38 Miller St Plattsburgh, NY 12901
Estimated Value: $173,678 - $213,000
About This Home
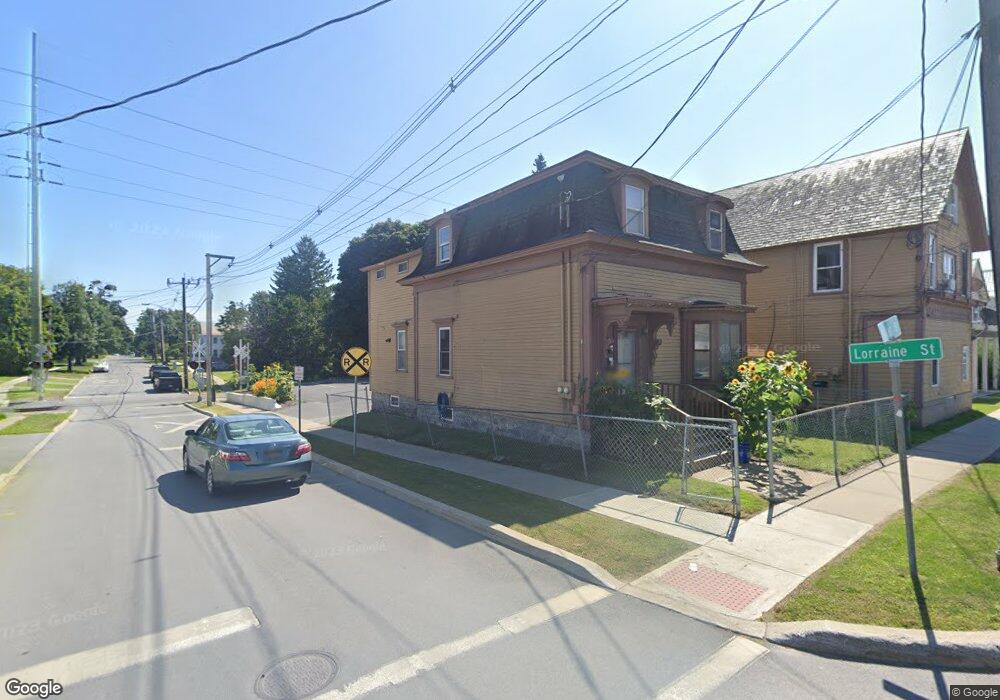
This home is located at 38 Miller St, Plattsburgh, NY 12901 and is currently estimated at $190,920, approximately $70 per square foot. 38 Miller St is a home located in Clinton County with nearby schools including Thomas E. Glasgow Elementary School, Oak Street School, and Stafford Middle School.
Ownership History
We collect this data history from publicly available records. To have your information removed, we recommend requesting removal directly through your county’s website.
Purchase Details
Purchase Details
Home Financials for this Owner
Home Financials are based on the most recent Mortgage that was taken out on this home.Purchase Details
Purchase Details
Purchase Details
Home Values in the Area
Average Home Value in this Area
Purchase History
We collect this data history from publicly available records. To have your information removed, we recommend requesting removal directly through your county’s website.
| Date | Buyer | Sale Price | Title Company |
|---|---|---|---|
| $164,000 | -- | ||
| $250,000 | -- | ||
| -- | Gary L. Favro, Esq. | ||
| $25,000 | Evan F Bracy | ||
| -- | -- |
Mortgage History
We collect this data history from publicly available records. To have your information removed, we recommend requesting removal directly through your county’s website.
| Date | Status | Borrower | Loan Amount |
|---|---|---|---|
| Previous Owner | $125,000 |
Tax History
We collect this data history from publicly available records. To have your information removed, we recommend requesting removal directly through your county’s website.
| Year | Tax Paid | Tax Assessment Tax Assessment Total Assessment is a certain percentage of the fair market value that is determined by local assessors to be the total taxable value of land and additions on the property. | Land | Improvement |
|---|---|---|---|---|
| 2025 | $2,050 | $155,300 | $13,900 | $141,400 |
| 2024 | $7,565 | $141,200 | $13,900 | $127,300 |
| 2023 | $7,157 | $127,100 | $13,900 | $113,200 |
| 2022 | $6,829 | $115,500 | $13,900 | $101,600 |
| 2021 | $6,639 | $102,100 | $13,900 | $88,200 |
| 2020 | $4,712 | $102,100 | $13,900 | $88,200 |
| 2019 | -- | $102,100 | $13,900 | $88,200 |
| 2018 | $3,965 | $96,000 | $10,400 | $85,600 |
| 2017 | $2,130 | $96,000 | $10,400 | $85,600 |
Map
- 43 Lorraine St
- 15 Nichols Ave
- 24 St Charles St
- 1186 Route 3
- 16 Robinson Terrace
- 72 Cornelia St
- 19 Stetson Ave
- 5241 N Catherine St
- 119 Cornelia St
- 82 Montcalm Ave
- 8 Lozier Place
- 9 Couch St
- 36 Champlain St
- 53 Champlain St
- 17 Lozier Place
- 0 Margaret St
- 42 William St
- 3 Helen St
- 62 Club Rd Unit 305
- 83 Bailey Ave
Ask me questions while you tour the home.