38 Mohawk Rd Marblehead, MA 01945
Estimated Value: $964,942 - $1,149,000
About This Home
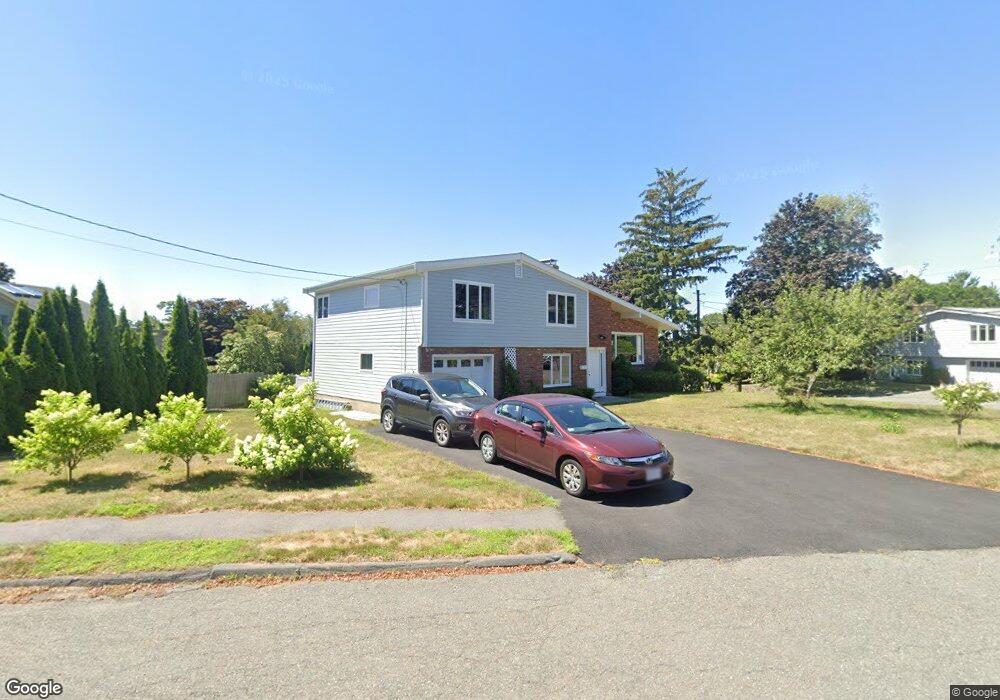
This home is located at 38 Mohawk Rd, Marblehead, MA 01945 and is currently estimated at $1,051,736, approximately $371 per square foot. 38 Mohawk Rd is a home located in Essex County with nearby schools including Marblehead High School, Devereux School, and Tower School.
Ownership History
We collect this data history from publicly available records. To have your information removed, we recommend requesting removal directly through your county’s website.
Purchase Details
Home Values in the Area
Average Home Value in this Area
Purchase History
We collect this data history from publicly available records. To have your information removed, we recommend requesting removal directly through your county’s website.
| Date | Buyer | Sale Price | Title Company |
|---|---|---|---|
| $490,000 | -- | ||
| $490,000 | -- |
Mortgage History
We collect this data history from publicly available records. To have your information removed, we recommend requesting removal directly through your county’s website.
| Date | Status | Borrower | Loan Amount |
|---|---|---|---|
| Open | $395,000 | ||
| Closed | $398,500 |
Tax History
We collect this data history from publicly available records. To have your information removed, we recommend requesting removal directly through your county’s website.
| Year | Tax Paid | Tax Assessment Tax Assessment Total Assessment is a certain percentage of the fair market value that is determined by local assessors to be the total taxable value of land and additions on the property. | Land | Improvement |
|---|---|---|---|---|
| 2025 | $7,797 | $861,500 | $600,300 | $261,200 |
| 2024 | $7,642 | $852,900 | $613,700 | $239,200 |
| 2023 | $7,552 | $755,200 | $540,300 | $214,900 |
| 2022 | $7,159 | $680,500 | $480,300 | $200,200 |
| 2021 | $6,774 | $650,100 | $453,600 | $196,500 |
| 2020 | $6,451 | $620,900 | $453,600 | $167,300 |
| 2019 | $6,239 | $580,900 | $413,600 | $167,300 |
| 2018 | $6,107 | $554,200 | $386,900 | $167,300 |
| 2017 | $5,954 | $540,800 | $373,500 | $167,300 |
| 2016 | $5,708 | $514,200 | $346,900 | $167,300 |
| 2015 | $5,134 | $463,400 | $293,500 | $169,900 |
| 2014 | $4,823 | $434,900 | $266,800 | $168,100 |
Map
- 82 Cornell Rd
- 27 Maverick St
- 2 Girdler Rd
- 282 Pleasant St
- 1 Maverick St Unit 2
- 19 Humphrey St
- 197A W Shore Dr Unit A
- 3 Countryside Ln
- 20 Ocean Ave Unit 4
- 53 Gerald Rd
- 67 Humphrey St Unit 1
- 67 Humphrey St
- 25 Countryside Ln
- 9 Cedar St
- 40 Prospect St Unit 3
- 28 Orchard St
- 58 Jersey St
- 290 Washington St Unit B
- 2 Commercial St Unit 3
- 26 Cedar St Unit 2
Ask me questions while you tour the home.