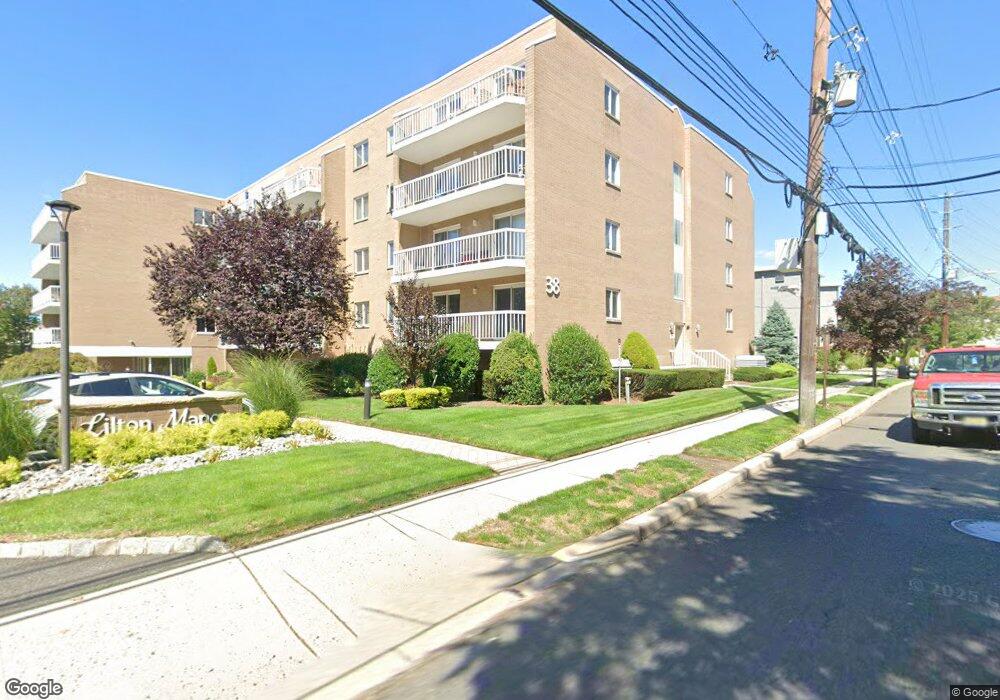
38 Moonachie Rd Hackensack, NJ 07601
Estimated Value: $455,000 - $464,000
Studio
--
Bath
1,095
Sq Ft
$419/Sq Ft
Est. Value
About This Home
This home is located at 38 Moonachie Rd, Hackensack, NJ 07601 and is currently estimated at $459,269, approximately $419 per square foot. 38 Moonachie Rd is a home located in Bergen County with nearby schools including Hackensack High School and George Washington School.
Ownership History
Date
Name
Owned For
Owner Type
Purchase Details
Closed on
Dec 28, 2023
Sold by
Huber Laura Anne
Bought by
Castillo Ana T and Castillo Alejandro J
Current Estimated Value
Home Financials for this Owner
Home Financials are based on the most recent Mortgage that was taken out on this home.
Original Mortgage
$320,000
Outstanding Balance
$314,484
Interest Rate
7.03%
Mortgage Type
New Conventional
Estimated Equity
$144,785
Purchase Details
Closed on
Jun 1, 2004
Sold by
Dejoy Robert
Bought by
Huber Laura A
Home Financials for this Owner
Home Financials are based on the most recent Mortgage that was taken out on this home.
Original Mortgage
$170,000
Interest Rate
6.32%
Create a Home Valuation Report for This Property
The Home Valuation Report is an in-depth analysis detailing your home's value as well as a comparison with similar homes in the area
Home Values in the Area
Average Home Value in this Area
Purchase History
| Date | Buyer | Sale Price | Title Company |
|---|---|---|---|
| Castillo Ana T | $400,000 | Guardian Title Services | |
| Castillo Ana T | $400,000 | Guardian Title Services | |
| Huber Laura A | $270,000 | -- |
Source: Public Records
Mortgage History
| Date | Status | Borrower | Loan Amount |
|---|---|---|---|
| Open | Castillo Ana T | $320,000 | |
| Closed | Castillo Ana T | $320,000 | |
| Previous Owner | Huber Laura A | $170,000 |
Source: Public Records
Tax History
| Year | Tax Paid | Tax Assessment Tax Assessment Total Assessment is a certain percentage of the fair market value that is determined by local assessors to be the total taxable value of land and additions on the property. | Land | Improvement |
|---|---|---|---|---|
| 2025 | $7,646 | $325,200 | $105,000 | $220,200 |
| 2024 | $7,203 | $250,200 | $105,000 | $145,200 |
| 2023 | $6,868 | $250,200 | $105,000 | $145,200 |
| 2022 | $6,868 | $245,100 | $100,000 | $145,100 |
| 2021 | $6,716 | $200,000 | $88,700 | $111,300 |
| 2020 | $6,618 | $200,000 | $88,700 | $111,300 |
| 2019 | $6,620 | $197,200 | $87,000 | $110,200 |
| 2018 | $6,526 | $191,200 | $86,500 | $104,700 |
| 2017 | $6,441 | $188,600 | $85,000 | $103,600 |
| 2016 | $6,334 | $187,500 | $85,000 | $102,500 |
| 2015 | $8,432 | $240,900 | $79,500 | $161,400 |
| 2014 | $8,003 | $240,900 | $79,500 | $161,400 |
Source: Public Records
Map
Nearby Homes
- 467 Hudson St
- 466B Liberty St
- 468 Liberty St Unit 201
- 460 Liberty St Unit 205
- 466 Liberty St Unit 308
- 462C Liberty St Unit 312
- 468a Liberty St Unit 101
- 9 Vreeland Ave Unit 3A
- 16 Maple Ave
- 85 Grove St
- 337 Hudson St
- 58 4th St
- 62 Frederick St Unit 1
- 151 4th St
- 23 Grand St
- 39 Summit St
- 180 Main St
- 15 Vogt Ln
- 221 4th St
- 78 Poplar Ave
- 38 Moonachie Rd
- 38 Moonachie Rd Unit 411
- 38 Moonachie Rd
- 38 Moonachie Rd
- 38 Moonachie Rd
- 38 Moonachie Rd
- 38 Moonachie Rd
- 38 Moonachie Rd
- 38 Moonachie Rd
- 38 Moonachie Rd
- 38 Moonachie Rd
- 38 Moonachie Rd
- 38 Moonachie Rd
- 38 Moonachie Rd
- 38 Moonachie Rd
- 38 Moonachie Rd
- 38 Moonachie Rd
- 38 Moonachie Rd
- 38 Moonachie Rd
- 38 Moonachie Rd
Your Personal Tour Guide
Ask me questions while you tour the home.