38 N Vine St Indianapolis, IN 46222
Garden City NeighborhoodEstimated Value: $136,000 - $169,934
3
Beds
--
Bath
1,167
Sq Ft
$127/Sq Ft
Est. Value
About This Home
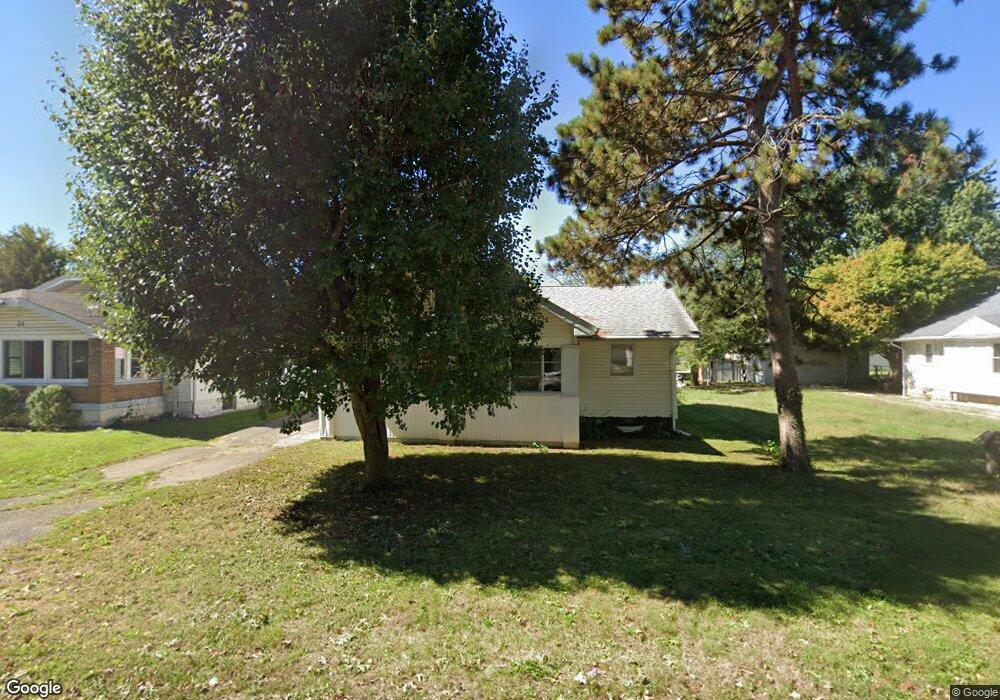
This home is located at 38 N Vine St, Indianapolis, IN 46222 and is currently estimated at $148,484, approximately $127 per square foot. 38 N Vine St is a home located in Marion County with nearby schools including Garden City Elementary School, Lynhurst 7th & 8th Grade Center, and Ben Davis University High School.
Ownership History
Date
Name
Owned For
Owner Type
Purchase Details
Closed on
Aug 7, 2024
Sold by
Bosserman Michael S and Bosserman Kristi L
Bought by
Bosserman Shelia Ann
Current Estimated Value
Home Financials for this Owner
Home Financials are based on the most recent Mortgage that was taken out on this home.
Original Mortgage
$72,000
Outstanding Balance
$71,198
Interest Rate
6.95%
Mortgage Type
New Conventional
Estimated Equity
$77,286
Create a Home Valuation Report for This Property
The Home Valuation Report is an in-depth analysis detailing your home's value as well as a comparison with similar homes in the area
Home Values in the Area
Average Home Value in this Area
Purchase History
| Date | Buyer | Sale Price | Title Company |
|---|---|---|---|
| Bosserman Shelia Ann | $96,000 | None Listed On Document |
Source: Public Records
Mortgage History
| Date | Status | Borrower | Loan Amount |
|---|---|---|---|
| Open | Bosserman Shelia Ann | $72,000 |
Source: Public Records
Tax History Compared to Growth
Tax History
| Year | Tax Paid | Tax Assessment Tax Assessment Total Assessment is a certain percentage of the fair market value that is determined by local assessors to be the total taxable value of land and additions on the property. | Land | Improvement |
|---|---|---|---|---|
| 2024 | $3,135 | $128,100 | $10,800 | $117,300 |
| 2023 | $3,135 | $128,100 | $10,800 | $117,300 |
| 2022 | $3,041 | $124,200 | $10,800 | $113,400 |
| 2021 | $2,487 | $87,700 | $10,800 | $76,900 |
| 2020 | $2,262 | $79,500 | $10,800 | $68,700 |
| 2019 | $2,103 | $73,700 | $10,800 | $62,900 |
| 2018 | $1,842 | $73,700 | $10,800 | $62,900 |
| 2017 | $1,815 | $72,700 | $10,800 | $61,900 |
| 2016 | $1,780 | $71,300 | $10,800 | $60,500 |
| 2014 | $1,378 | $68,900 | $10,800 | $58,100 |
| 2013 | $1,308 | $65,400 | $10,800 | $54,600 |
Source: Public Records
Map
Nearby Homes
- 317 S Lyons Ave
- 332 Laclede St
- 507 S Cole St
- 360 Laclede St
- 206 Cossell Dr
- 5007 Jackson St
- 312 Cossell Dr
- 603 Woodrow Ave
- 2405 S Lockburn St
- 2722 S Lyons Ave
- 4024 Cossell Rd
- 635 Laclede St
- 4009 Oliver Ave
- 617 Grande Ave
- 810 S Roena St
- 809 S Roena St
- 625 Collier St
- 2814 S Rybolt Ave
- 3646 Creston Dr
- 459 S Holt Rd