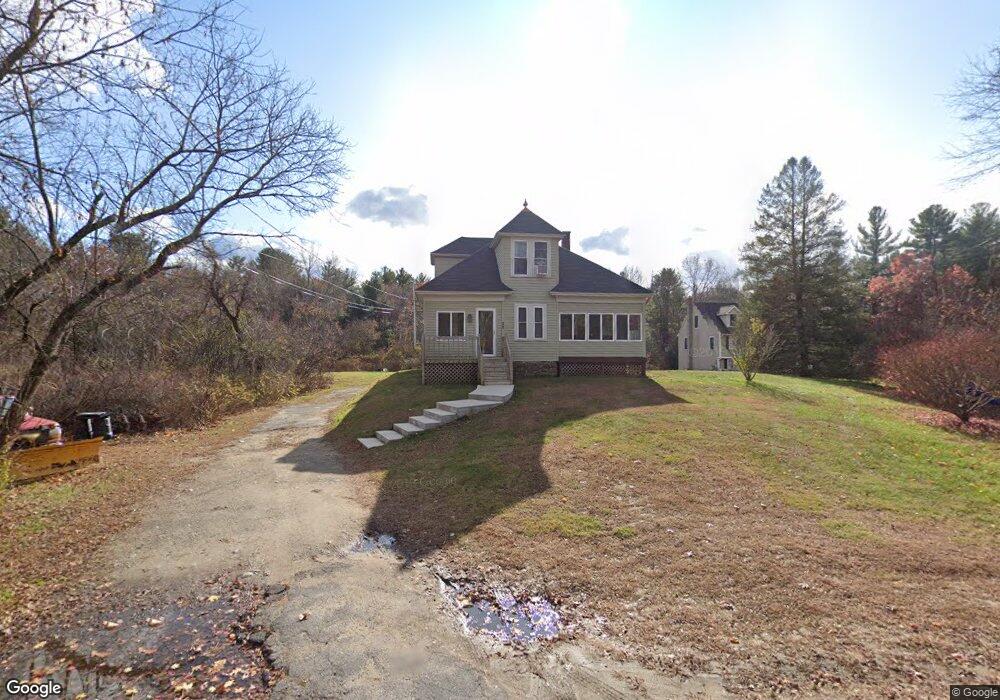
38 North St Methuen, MA 01844
The North End NeighborhoodEstimated Value: $532,000 - $561,000
3
Beds
1
Bath
1,736
Sq Ft
$316/Sq Ft
Est. Value
About This Home
This home is located at 38 North St, Methuen, MA 01844 and is currently estimated at $548,582, approximately $316 per square foot. 38 North St is a home located in Essex County with nearby schools including Methuen High School, Hilltop School, and St. Joseph Regional Catholic School.
Ownership History
Date
Name
Owned For
Owner Type
Purchase Details
Closed on
Oct 14, 2011
Sold by
Gaffney Frank
Bought by
Gaffney Frank and Gaffney Theresa A
Current Estimated Value
Purchase Details
Closed on
Jun 20, 2011
Sold by
Department Of Housing & Urban Dev
Bought by
Gaffney Frank
Home Financials for this Owner
Home Financials are based on the most recent Mortgage that was taken out on this home.
Original Mortgage
$101,050
Interest Rate
4.74%
Mortgage Type
Purchase Money Mortgage
Purchase Details
Closed on
Dec 9, 2010
Sold by
Wells Fargo Bk
Bought by
Department Of Housing & Urban Dev
Purchase Details
Closed on
Jul 13, 2010
Sold by
Madera Iris and Wells Fargo Bk
Bought by
Wells Fargo Bk
Purchase Details
Closed on
Jan 22, 2007
Sold by
Cannata Anthohy M and Madera Iris A
Bought by
Cannata Anthony M
Purchase Details
Closed on
May 15, 2001
Sold by
North Rt
Bought by
Cannata Anthony M and Madera Iris A
Purchase Details
Closed on
Jun 6, 1991
Sold by
Jones Louis P
Bought by
Magog Rt
Purchase Details
Closed on
Jan 26, 1989
Sold by
Gordon Helen
Bought by
Jones Louis
Create a Home Valuation Report for This Property
The Home Valuation Report is an in-depth analysis detailing your home's value as well as a comparison with similar homes in the area
Home Values in the Area
Average Home Value in this Area
Purchase History
| Date | Buyer | Sale Price | Title Company |
|---|---|---|---|
| Gaffney Frank | -- | -- | |
| Gaffney Frank | $110,000 | -- | |
| Department Of Housing & Urban Dev | -- | -- | |
| Wells Fargo Bk | $192,047 | -- | |
| Cannata Anthony M | -- | -- | |
| Cannata Anthony M | $170,000 | -- | |
| Magog Rt | $50,000 | -- | |
| Jones Louis | $60,000 | -- |
Source: Public Records
Mortgage History
| Date | Status | Borrower | Loan Amount |
|---|---|---|---|
| Previous Owner | Gaffney Frank | $101,050 | |
| Previous Owner | Jones Louis | $168,874 | |
| Previous Owner | Jones Louis | $40,000 |
Source: Public Records
Tax History Compared to Growth
Tax History
| Year | Tax Paid | Tax Assessment Tax Assessment Total Assessment is a certain percentage of the fair market value that is determined by local assessors to be the total taxable value of land and additions on the property. | Land | Improvement |
|---|---|---|---|---|
| 2025 | $5,231 | $494,400 | $277,700 | $216,700 |
| 2024 | $4,874 | $448,800 | $232,100 | $216,700 |
| 2023 | $4,963 | $424,200 | $231,800 | $192,400 |
| 2022 | $4,796 | $367,500 | $190,400 | $177,100 |
| 2021 | $4,543 | $344,400 | $180,100 | $164,300 |
| 2020 | $4,457 | $331,600 | $180,100 | $151,500 |
| 2019 | $4,196 | $295,700 | $169,700 | $126,000 |
| 2018 | $3,944 | $276,400 | $159,300 | $117,100 |
| 2017 | $3,881 | $264,900 | $159,300 | $105,600 |
| 2016 | $3,541 | $239,100 | $138,600 | $100,500 |
| 2015 | $3,491 | $239,100 | $138,600 | $100,500 |
Source: Public Records
Map
Nearby Homes
- 47 Bailey Ct
- 1513 Broadway
- 74 Ayers Village Rd
- 139 North St
- 25 Thayer St
- 28 Emma Rose Cir Unit Lot 2
- 2 Danforth Ct
- 132 W Meadow Rd Unit 18
- 257 Howe St
- 16 W Parish Ct
- 1 W Parish Ct
- 40 Stanwood Rd Unit 9
- 186 Mohawk Trail
- 20 Stanwood Rd
- 81 Clement Ct
- 12 Cameron Way
- 17 Sawmill Ridge Rd
- 29 Prescott St
- 216 Morgan Dr Unit 216
- 1 Ballard Ln