

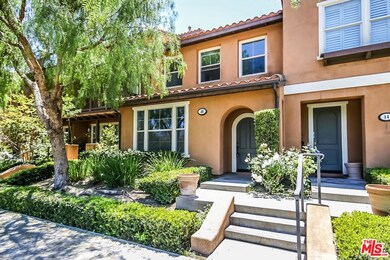


38 Pathway Irvine, CA 92618
Portola Springs Neighborhood
3
Beds
2.5
Baths
1,676
Sq Ft
$450/mo
HOA Fee
Highlights
- In Ground Pool
- Clubhouse
- Modern Architecture
- Portola Springs Elementary Rated A
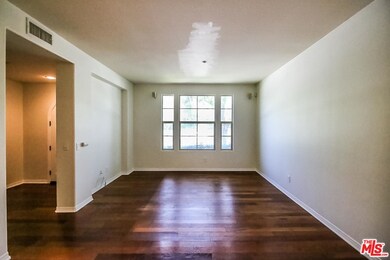
- Wood Flooring
- 1-minute walk to Silverado Park
About This Home
As of August 2017Located in the fabulous new area of Portola Springs in Irvine. This 3bed 2.5bath home comes with ceramic tile, hardwood, and partially carpeted floor.Fantastic kitchen with huge center island and convenient laundry room. you can enjoy the resort style association pool, basketball court, and park at right in front of the place. Also, Portola has one of the highest rated school districts in Irvine.
Last Buyer's Agent
Yun Chyang
License #01936876
Property Details
Home Type
- Condominium
Est. Annual Taxes
- $9,377
Year Built
- Built in 2007
HOA Fees
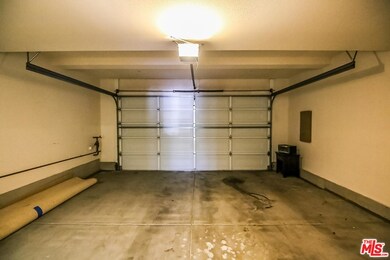
Parking
- 2 Covered Spaces
Home Design
- Modern Architecture
Interior Spaces
- 1,676 Sq Ft Home
- 2-Story Property
- Furnished
- Family Room on Second Floor
- Dishwasher
- Laundry Room
- Property Views
Flooring
- Wood
- Carpet
- Tile
Bedrooms and Bathrooms
- 3 Bedrooms
Home Security
Additional Features
- In Ground Pool
- Central Heating and Cooling System
Listing and Financial Details
- Assessor Parcel Number 930-279-00
Community Details
Amenities
- Outdoor Cooking Area
- Community Barbecue Grill
- Clubhouse
- Meeting Room
- Recreation Room
Recreation
- Tennis Courts
- Sport Court
- Community Playground
- Community Pool
- Community Spa
- Bike Trail
Pet Policy
- Pets Allowed
Security
- Carbon Monoxide Detectors
- Fire and Smoke Detector
- Fire Sprinkler System
Ownership History
Date
Name
Owned For
Owner Type
Purchase Details
Closed on
Feb 10, 2021
Sold by
Yu Francis Lawrence and Zhu Kaylyn Weiyi
Bought by
Zhu Kaylyn Weiyi
Total Days on Market
13
Current Estimated Value
Purchase Details
Listed on
Jun 27, 2017
Closed on
Jul 26, 2017
Sold by
Namu Llc
Bought by
Yu Francis Lawrence and Zhu Weiyi
Seller's Agent
Ray H. Kang
CenoCORE,Inc.
Buyer's Agent
Yun Chyang
List Price
$619,000
Sold Price
$625,000
Premium/Discount to List
$6,000
0.97%
Home Financials for this Owner
Home Financials are based on the most recent Mortgage that was taken out on this home.
Avg. Annual Appreciation
8.99%
Original Mortgage
$468,750
Outstanding Balance
$393,411
Interest Rate
3.91%
Mortgage Type
New Conventional
Estimated Equity
$828,460
Purchase Details
Closed on
Feb 23, 2011
Sold by
Namu Llc
Bought by
Namu Llc
Home Financials for this Owner
Home Financials are based on the most recent Mortgage that was taken out on this home.
Original Mortgage
$375,000
Interest Rate
4.71%
Mortgage Type
Purchase Money Mortgage
Purchase Details
Closed on
Jul 1, 2010
Sold by
Park Jin
Bought by
Namu Llc
Home Financials for this Owner
Home Financials are based on the most recent Mortgage that was taken out on this home.
Original Mortgage
$372,100
Interest Rate
4.76%
Mortgage Type
New Conventional
Purchase Details
Closed on
Apr 23, 2010
Sold by
Namu Llc
Bought by
Park Jin
Purchase Details
Closed on
May 7, 2008
Sold by
Park Jin
Bought by
Namu Llc
Purchase Details
Closed on
Sep 12, 2007
Sold by
Park Jin and Park Hay Young
Bought by
Park Jin
Home Financials for this Owner
Home Financials are based on the most recent Mortgage that was taken out on this home.
Original Mortgage
$100,000
Interest Rate
6.57%
Mortgage Type
Credit Line Revolving
Purchase Details
Closed on
Aug 29, 2007
Sold by
Park See Kook
Bought by
Park Hay Young
Home Financials for this Owner
Home Financials are based on the most recent Mortgage that was taken out on this home.
Original Mortgage
$100,000
Interest Rate
6.57%
Mortgage Type
Credit Line Revolving
Purchase Details
Closed on
Aug 27, 2007
Sold by
Park Jin
Bought by
Park Jin and Park Hay Young
Home Financials for this Owner
Home Financials are based on the most recent Mortgage that was taken out on this home.
Original Mortgage
$100,000
Interest Rate
6.57%
Mortgage Type
Credit Line Revolving
Purchase Details
Closed on
Jun 19, 2007
Sold by
Wl Homes Llc
Bought by
Park Jin
Map
Create a Home Valuation Report for This Property
The Home Valuation Report is an in-depth analysis detailing your home's value as well as a comparison with similar homes in the area
Similar Homes in the area
Home Values in the Area
Average Home Value in this Area
Purchase History
| Date | Type | Sale Price | Title Company |
|---|---|---|---|
| Interfamily Deed Transfer | -- | Accommodation | |
| Grant Deed | $625,000 | Provident Title Company | |
| Quit Claim Deed | -- | -- | |
| Quit Claim Deed | -- | Chicago Title Company | |
| Grant Deed | -- | Accommodation | |
| Grant Deed | -- | Accommodation | |
| Interfamily Deed Transfer | -- | Accommodation | |
| Interfamily Deed Transfer | -- | Chicago Title Co | |
| Interfamily Deed Transfer | -- | Chicago Title Co | |
| Grant Deed | $626,000 | Fidelity National Title |
Source: Public Records
Mortgage History
| Date | Status | Loan Amount | Loan Type |
|---|---|---|---|
| Open | $468,750 | New Conventional | |
| Previous Owner | $375,000 | Purchase Money Mortgage | |
| Previous Owner | $372,100 | New Conventional | |
| Previous Owner | $100,000 | Credit Line Revolving | |
| Previous Owner | $417,000 | New Conventional |
Source: Public Records
Property History
| Date | Event | Price | Change | Sq Ft Price |
|---|---|---|---|---|
| 10/16/2019 10/16/19 | Rented | $3,000 | 0.0% | -- |
| 10/13/2019 10/13/19 | Price Changed | $3,000 | -3.2% | $2 / Sq Ft |
| 10/08/2019 10/08/19 | For Rent | $3,100 | 0.0% | -- |
| 08/14/2017 08/14/17 | Sold | $625,000 | +1.0% | $373 / Sq Ft |
| 06/27/2017 06/27/17 | For Sale | $619,000 | 0.0% | $369 / Sq Ft |
| 05/17/2014 05/17/14 | Rented | $2,700 | -5.3% | -- |
| 04/17/2014 04/17/14 | Under Contract | -- | -- | -- |
| 10/15/2013 10/15/13 | For Rent | $2,850 | +3.6% | -- |
| 06/16/2012 06/16/12 | Rented | $2,750 | 0.0% | -- |
| 06/16/2012 06/16/12 | Under Contract | -- | -- | -- |
| 06/08/2012 06/08/12 | For Rent | $2,750 | -- | -- |
Source: The MLS
Tax History
| Year | Tax Paid | Tax Assessment Tax Assessment Total Assessment is a certain percentage of the fair market value that is determined by local assessors to be the total taxable value of land and additions on the property. | Land | Improvement |
|---|---|---|---|---|
| 2024 | $9,377 | $697,197 | $450,269 | $246,928 |
| 2023 | $9,528 | $683,527 | $441,440 | $242,087 |
| 2022 | $9,343 | $670,125 | $432,784 | $237,341 |
| 2021 | $9,226 | $656,986 | $424,298 | $232,688 |
| 2020 | $9,156 | $650,250 | $419,947 | $230,303 |
| 2019 | $9,420 | $637,500 | $411,712 | $225,788 |
| 2018 | $9,400 | $625,000 | $403,639 | $221,361 |
| 2017 | $10,185 | $706,000 | $464,025 | $241,975 |
| 2016 | $10,171 | $706,000 | $464,025 | $241,975 |
| 2015 | $9,676 | $658,000 | $416,025 | $241,975 |
| 2014 | $9,335 | $625,000 | $383,025 | $241,975 |
Source: Public Records
Source: The MLS
MLS Number: 17-243610
APN: 930-279-00
Disclaimer: Certain information contained herein is derived from information provided by parties other than Homes.com. All information provided is deemed reliable, but is not guaranteed to be accurate and should be independently verified.
![]() © 2025 The MLS™ - Combined L.A. Westside MLS (CLAW). All rights reserved. Based on information from The MLS™ - Combined L.A. Westside MLS (CLAW). All data, including all measurements and calculations of area, is obtained from various sources and has not been, and will not be, verified by broker or MLS. All information should be independently reviewed and verified for accuracy. Properties may or may not be listed by the office/agent presenting the information.
© 2025 The MLS™ - Combined L.A. Westside MLS (CLAW). All rights reserved. Based on information from The MLS™ - Combined L.A. Westside MLS (CLAW). All data, including all measurements and calculations of area, is obtained from various sources and has not been, and will not be, verified by broker or MLS. All information should be independently reviewed and verified for accuracy. Properties may or may not be listed by the office/agent presenting the information.
IDX information is provided exclusively for personal, non-commercial use, and may not be used for any purpose other than to identify prospective properties consumers may be interested in purchasing.
Information is deemed reliable but not guaranteed.
Nearby Homes