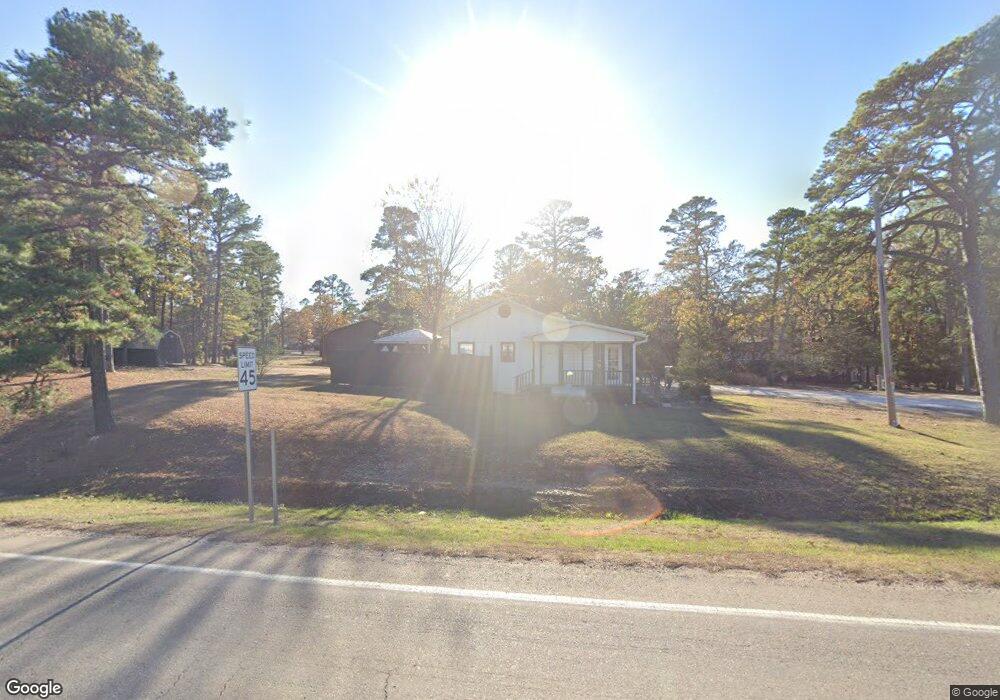
38 Pine Meadow Ln Broken Bow, OK 74728
Estimated Value: $656,000 - $793,259
3
Beds
2
Baths
792
Sq Ft
$909/Sq Ft
Est. Value
About This Home
This home is located at 38 Pine Meadow Ln, Broken Bow, OK 74728 and is currently estimated at $719,815, approximately $908 per square foot. 38 Pine Meadow Ln is a home located in McCurtain County with nearby schools including Dierks Elementary School, Bennett Elementary School, and Rector Johnson Middle School.
Ownership History
Date
Name
Owned For
Owner Type
Purchase Details
Closed on
Jan 15, 2021
Sold by
The Finchs Nest Llc
Bought by
Piotrowski Blake and Piotrowski Lisa
Current Estimated Value
Home Financials for this Owner
Home Financials are based on the most recent Mortgage that was taken out on this home.
Original Mortgage
$440,000
Outstanding Balance
$390,899
Interest Rate
2.71%
Mortgage Type
New Conventional
Estimated Equity
$328,916
Purchase Details
Closed on
Jun 5, 2018
Sold by
Finch Michelle
Bought by
The Finchs Nest
Purchase Details
Closed on
Feb 21, 2011
Sold by
Finch Robert Dean
Bought by
Finch Robert Dean and Finch Michelle D
Home Financials for this Owner
Home Financials are based on the most recent Mortgage that was taken out on this home.
Original Mortgage
$155,350
Interest Rate
4.7%
Mortgage Type
New Conventional
Create a Home Valuation Report for This Property
The Home Valuation Report is an in-depth analysis detailing your home's value as well as a comparison with similar homes in the area
Home Values in the Area
Average Home Value in this Area
Purchase History
| Date | Buyer | Sale Price | Title Company |
|---|---|---|---|
| Piotrowski Blake | $550,000 | None Available | |
| The Finchs Nest | -- | None Available | |
| Finch Robert Dean | -- | -- | |
| Finch Robert Dean | -- | -- |
Source: Public Records
Mortgage History
| Date | Status | Borrower | Loan Amount |
|---|---|---|---|
| Open | Piotrowski Blake | $440,000 | |
| Previous Owner | Finch Robert Dean | $155,350 |
Source: Public Records
Tax History
| Year | Tax Paid | Tax Assessment Tax Assessment Total Assessment is a certain percentage of the fair market value that is determined by local assessors to be the total taxable value of land and additions on the property. | Land | Improvement |
|---|---|---|---|---|
| 2025 | $5,562 | $66,701 | $5,363 | $61,338 |
| 2023 | $4,961 | $60,500 | $4,400 | $56,100 |
| 2022 | $4,962 | $60,500 | $4,400 | $56,100 |
| 2021 | $1,814 | $22,505 | $4,400 | $18,105 |
| 2020 | $1,844 | $22,697 | $4,400 | $18,297 |
| 2019 | $1,869 | $22,898 | $4,400 | $18,498 |
| 2018 | $1,906 | $23,091 | $4,400 | $18,691 |
| 2017 | $1,938 | $23,283 | $4,400 | $18,883 |
| 2016 | $1,938 | $23,109 | $4,400 | $18,709 |
| 2015 | $1,983 | $23,096 | $4,400 | $18,696 |
| 2014 | $1,994 | $23,096 | $4,400 | $18,696 |
Source: Public Records
Map
Nearby Homes
- 141 Wildwood Trail
- 129 Poplar Cir
- 130 Wildwood Trail
- 183 Pine Meadow Ln
- 240 Pine Meadow Ln
- 94 Willow Bend Rd
- 4 Hornbeam Rd
- 114 Willow Bend Rd
- 134 Willow Bend Rd
- 435 Poplar Cir
- 289 Timber Hills Ln
- 263 Orca Rd
- 179 Timber Hills Ln
- o Stephens Gap Rd
- 182 Orange Blossom Ln
- 295 Orca Rd
- 341 Orca Rd
- 64 Willow Bend Rd
- 44 Pine Bluff Rd
- 302 Orca Rd
- 38 Pine Meadow Ln
- 38 Pine Meadow Ln Unit 5807433174
- 203 Poplar Rd
- 160 Kaniatobe Trail
- 215 Poplar Rd
- 154 Wildwood Trail
- 162 Poplar Cir
- 140 Wildwood Trail
- 238 Poplar Rd
- 121 Kaniatobe Trail
- 154 Poplar Rd
- 144 Wildwood Trail
- 194 Pine Meadow Ln
- 242 Poplar Rd Unit 5807433174
- 299 Poplar Cir
- 44 Wildwood Trail
- 245 Poplar Rd
- 20 Poplar
- 151 Pine Meadow Ln
- 46 Pine Meadow Ln
Your Personal Tour Guide
Ask me questions while you tour the home.