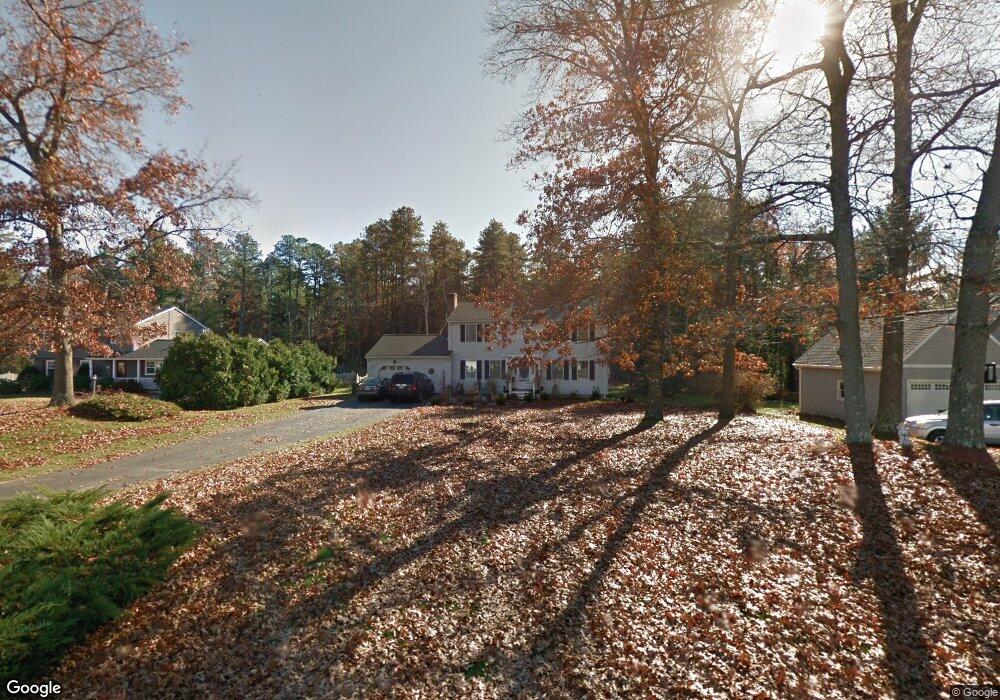
38 Plain St Easthampton, MA 01027
Estimated Value: $552,000 - $584,000
4
Beds
3
Baths
2,060
Sq Ft
$274/Sq Ft
Est. Value
About This Home
This home is located at 38 Plain St, Easthampton, MA 01027 and is currently estimated at $564,965, approximately $274 per square foot. 38 Plain St is a home located in Hampshire County with nearby schools including Easthampton High School, Calvary Baptist Christian School, and Tri-County Schools.
Ownership History
Date
Name
Owned For
Owner Type
Purchase Details
Closed on
Aug 12, 2016
Sold by
Rist Daniel D and Rist Patricia A
Bought by
Rist Matthew J and Rist Rex Jennifer
Current Estimated Value
Home Financials for this Owner
Home Financials are based on the most recent Mortgage that was taken out on this home.
Original Mortgage
$312,500
Outstanding Balance
$246,620
Interest Rate
3.48%
Mortgage Type
New Conventional
Estimated Equity
$318,345
Create a Home Valuation Report for This Property
The Home Valuation Report is an in-depth analysis detailing your home's value as well as a comparison with similar homes in the area
Home Values in the Area
Average Home Value in this Area
Purchase History
| Date | Buyer | Sale Price | Title Company |
|---|---|---|---|
| Rist Matthew J | $329,000 | -- |
Source: Public Records
Mortgage History
| Date | Status | Borrower | Loan Amount |
|---|---|---|---|
| Open | Rist Matthew J | $312,500 |
Source: Public Records
Tax History
| Year | Tax Paid | Tax Assessment Tax Assessment Total Assessment is a certain percentage of the fair market value that is determined by local assessors to be the total taxable value of land and additions on the property. | Land | Improvement |
|---|---|---|---|---|
| 2025 | $6,220 | $455,000 | $123,600 | $331,400 |
| 2024 | $5,996 | $442,200 | $120,000 | $322,200 |
| 2023 | $4,503 | $307,400 | $95,200 | $212,200 |
| 2022 | $5,081 | $307,400 | $95,200 | $212,200 |
| 2021 | $5,594 | $318,900 | $95,200 | $223,700 |
| 2020 | $5,459 | $307,400 | $95,200 | $212,200 |
| 2019 | $4,681 | $302,800 | $95,200 | $207,600 |
| 2018 | $4,504 | $281,500 | $89,900 | $191,600 |
| 2017 | $4,393 | $271,000 | $86,300 | $184,700 |
| 2016 | $4,220 | $270,700 | $86,300 | $184,400 |
| 2015 | $4,101 | $270,700 | $86,300 | $184,400 |
Source: Public Records
Map
Nearby Homes
Your Personal Tour Guide
Ask me questions while you tour the home.