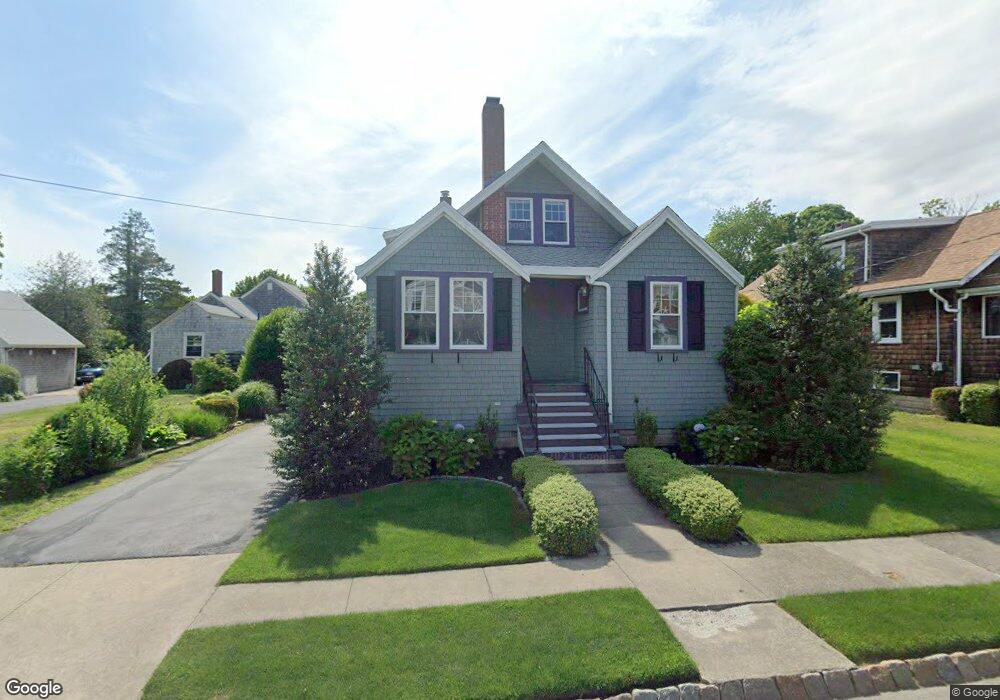
38 Pleasant St Unit 2 Fairhaven, MA 02719
Estimated Value: $628,733 - $744,000
2
Beds
2
Baths
1,000
Sq Ft
$662/Sq Ft
Est. Value
About This Home
This home is located at 38 Pleasant St Unit 2, Fairhaven, MA 02719 and is currently estimated at $662,433, approximately $662 per square foot. 38 Pleasant St Unit 2 is a home located in Bristol County with nearby schools including Fairhaven High School, City On A Hill Charter Public School New Bedford, and St. Joseph School.
Ownership History
Date
Name
Owned For
Owner Type
Purchase Details
Closed on
Aug 31, 2010
Sold by
Makepeace Susan R
Bought by
Furlani Carla
Current Estimated Value
Home Financials for this Owner
Home Financials are based on the most recent Mortgage that was taken out on this home.
Original Mortgage
$344,362
Outstanding Balance
$228,085
Interest Rate
4.5%
Mortgage Type
FHA
Estimated Equity
$434,348
Purchase Details
Closed on
Aug 24, 2004
Sold by
Isherwood Elizabeth M
Bought by
Makepeace Susan R and Isherwood Elizabeth M
Create a Home Valuation Report for This Property
The Home Valuation Report is an in-depth analysis detailing your home's value as well as a comparison with similar homes in the area
Home Values in the Area
Average Home Value in this Area
Purchase History
| Date | Buyer | Sale Price | Title Company |
|---|---|---|---|
| Furlani Carla | $349,000 | -- | |
| Makepeace Susan R | $377,000 | -- |
Source: Public Records
Mortgage History
| Date | Status | Borrower | Loan Amount |
|---|---|---|---|
| Open | Makepeace Susan R | $344,362 | |
| Previous Owner | Makepeace Susan R | $60,500 | |
| Previous Owner | Makepeace Susan R | $60,000 |
Source: Public Records
Tax History Compared to Growth
Tax History
| Year | Tax Paid | Tax Assessment Tax Assessment Total Assessment is a certain percentage of the fair market value that is determined by local assessors to be the total taxable value of land and additions on the property. | Land | Improvement |
|---|---|---|---|---|
| 2025 | $49 | $528,600 | $182,700 | $345,900 |
| 2024 | $4,784 | $518,300 | $182,700 | $335,600 |
| 2023 | $4,754 | $477,800 | $169,300 | $308,500 |
| 2022 | $4,616 | $451,700 | $161,300 | $290,400 |
| 2021 | $4,497 | $398,300 | $146,700 | $251,600 |
| 2020 | $4,331 | $391,600 | $140,000 | $251,600 |
| 2019 | $4,513 | $386,700 | $127,500 | $259,200 |
| 2018 | $4,255 | $362,100 | $121,300 | $240,800 |
| 2017 | $4,127 | $342,800 | $121,300 | $221,500 |
| 2016 | $3,961 | $325,200 | $121,300 | $203,900 |
| 2015 | $3,881 | $319,400 | $121,300 | $198,100 |
Source: Public Records
Map
Nearby Homes