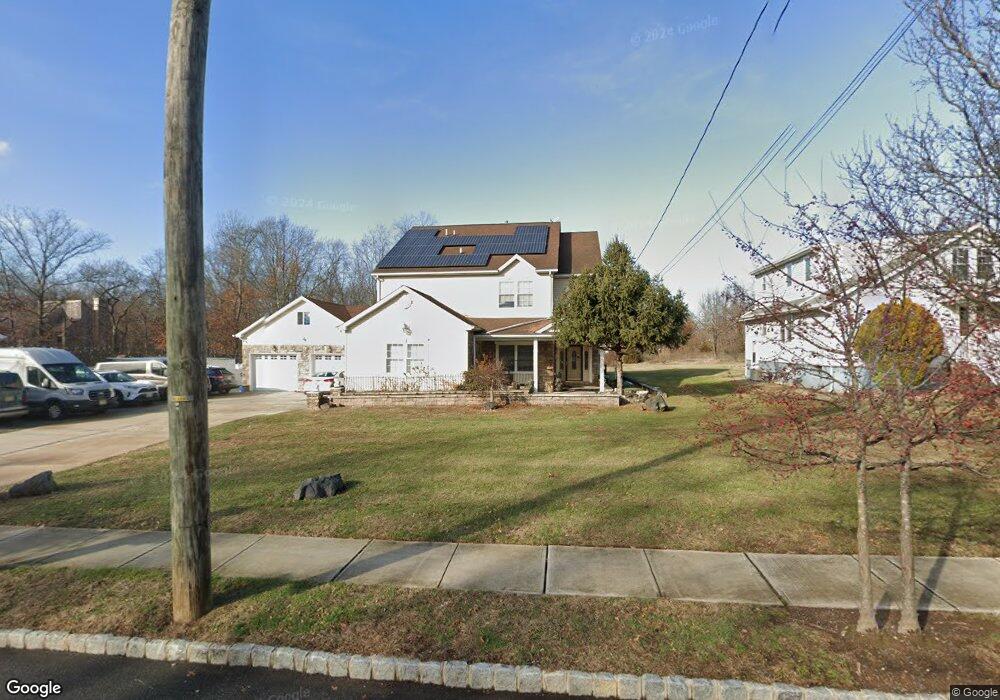
38 Poplar Rd Piscataway, NJ 08854
Estimated Value: $852,000 - $1,186,357
4
Beds
4
Baths
4,080
Sq Ft
$260/Sq Ft
Est. Value
About This Home
This home is located at 38 Poplar Rd, Piscataway, NJ 08854 and is currently estimated at $1,061,589, approximately $260 per square foot. 38 Poplar Rd is a home located in Middlesex County with nearby schools including Randolphville Elementary School, Martin Luther King Intermediate School, and Quibbletown Middle School.
Ownership History
Date
Name
Owned For
Owner Type
Purchase Details
Closed on
Jun 23, 2015
Sold by
Putel Kiran B and Patel Jagruthi
Bought by
Patel Kiran B and Patel Jagruti
Current Estimated Value
Home Financials for this Owner
Home Financials are based on the most recent Mortgage that was taken out on this home.
Original Mortgage
$250,000
Outstanding Balance
$195,411
Interest Rate
4.01%
Mortgage Type
New Conventional
Estimated Equity
$866,178
Purchase Details
Closed on
Oct 18, 2014
Bought by
Patel K B K K and Patel Patel, J
Create a Home Valuation Report for This Property
The Home Valuation Report is an in-depth analysis detailing your home's value as well as a comparison with similar homes in the area
Home Values in the Area
Average Home Value in this Area
Purchase History
| Date | Buyer | Sale Price | Title Company |
|---|---|---|---|
| Patel Kiran B | -- | Multiple | |
| Patel K B K K | $435,000 | -- | |
| Patel Kiran B | $434,500 | Golden Title Agency |
Source: Public Records
Mortgage History
| Date | Status | Borrower | Loan Amount |
|---|---|---|---|
| Open | Patel Kiran B | $250,000 |
Source: Public Records
Tax History Compared to Growth
Tax History
| Year | Tax Paid | Tax Assessment Tax Assessment Total Assessment is a certain percentage of the fair market value that is determined by local assessors to be the total taxable value of land and additions on the property. | Land | Improvement |
|---|---|---|---|---|
| 2025 | $17,817 | $902,400 | $294,300 | $608,100 |
| 2024 | $16,990 | $910,900 | $189,900 | $721,000 |
| 2023 | $16,990 | $812,900 | $189,900 | $623,000 |
| 2022 | $15,824 | $705,800 | $189,900 | $515,900 |
| 2021 | $15,237 | $651,700 | $189,900 | $461,800 |
| 2020 | $14,654 | $628,400 | $189,900 | $438,500 |
| 2019 | $13,920 | $587,100 | $189,900 | $397,200 |
| 2018 | $13,434 | $567,800 | $189,900 | $377,900 |
| 2017 | $12,322 | $450,700 | $109,900 | $340,800 |
| 2016 | $12,097 | $450,700 | $109,900 | $340,800 |
| 2015 | $11,921 | $450,700 | $109,900 | $340,800 |
| 2014 | $11,628 | $450,700 | $109,900 | $340,800 |
Source: Public Records
Map
Nearby Homes