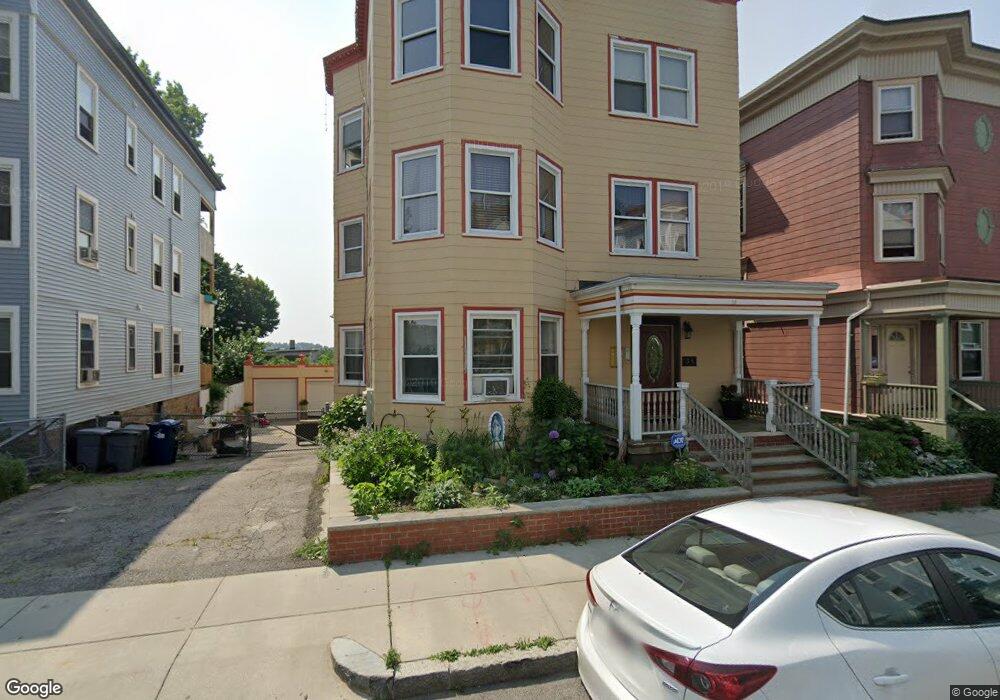
38 Robinson St Unit 3 Dorchester, MA 02122
Meeting House Hill NeighborhoodEstimated Value: $837,674 - $1,259,000
4
Beds
1
Bath
99,999
Sq Ft
$11/Sq Ft
Est. Value
About This Home
This home is located at 38 Robinson St Unit 3, Dorchester, MA 02122 and is currently estimated at $1,123,669, approximately $11 per square foot. 38 Robinson St Unit 3 is a home located in Suffolk County with nearby schools including UP Academy Charter School of Dorchester and Helen Y. Davis Leadership Academy Charter Public School.
Ownership History
Date
Name
Owned For
Owner Type
Purchase Details
Closed on
May 9, 2018
Sold by
Dejesus-Grullon Dennis
Bought by
Rosario Altagracia A
Current Estimated Value
Home Financials for this Owner
Home Financials are based on the most recent Mortgage that was taken out on this home.
Original Mortgage
$400,000
Outstanding Balance
$344,730
Interest Rate
4.44%
Mortgage Type
New Conventional
Estimated Equity
$778,939
Purchase Details
Closed on
Oct 2, 2007
Sold by
Rosario Altagracia and Rosario Rafael A
Bought by
Grullon Dennis D and Dejesus-Grullon Dennis
Home Financials for this Owner
Home Financials are based on the most recent Mortgage that was taken out on this home.
Original Mortgage
$423,750
Interest Rate
6.65%
Mortgage Type
Purchase Money Mortgage
Purchase Details
Closed on
Feb 1, 2000
Sold by
Rosa Jesus A and Rosa Maria A
Bought by
Rosario Altagracia and Rosario Rafael A
Purchase Details
Closed on
Jul 31, 1991
Sold by
Small Thomas L and Seifert Maxine
Bought by
Rosa Jesus A and Rosa Maria A
Create a Home Valuation Report for This Property
The Home Valuation Report is an in-depth analysis detailing your home's value as well as a comparison with similar homes in the area
Home Values in the Area
Average Home Value in this Area
Purchase History
| Date | Buyer | Sale Price | Title Company |
|---|---|---|---|
| Rosario Altagracia A | $500,000 | -- | |
| Grullon Dennis D | $565,000 | -- | |
| Rosario Altagracia | $240,000 | -- | |
| Rosa Jesus A | $160,000 | -- |
Source: Public Records
Mortgage History
| Date | Status | Borrower | Loan Amount |
|---|---|---|---|
| Open | Rosario Altagracia A | $400,000 | |
| Previous Owner | Grullon Dennis D | $423,750 | |
| Previous Owner | Rosa Jesus A | $192,200 | |
| Previous Owner | Rosa Jesus A | $89,797 | |
| Previous Owner | Rosa Jesus A | $244,800 |
Source: Public Records
Tax History Compared to Growth
Tax History
| Year | Tax Paid | Tax Assessment Tax Assessment Total Assessment is a certain percentage of the fair market value that is determined by local assessors to be the total taxable value of land and additions on the property. | Land | Improvement |
|---|---|---|---|---|
| 2025 | $12,762 | $1,102,100 | $352,800 | $749,300 |
| 2024 | $11,833 | $1,085,600 | $304,400 | $781,200 |
| 2023 | $10,798 | $1,005,400 | $281,900 | $723,500 |
| 2022 | $9,945 | $914,100 | $256,300 | $657,800 |
| 2021 | $9,288 | $870,500 | $244,100 | $626,400 |
| 2020 | $7,694 | $728,600 | $273,200 | $455,400 |
| 2019 | $6,718 | $637,400 | $194,700 | $442,700 |
| 2018 | $5,963 | $569,000 | $194,700 | $374,300 |
| 2017 | $5,850 | $552,400 | $194,700 | $357,700 |
| 2016 | $5,377 | $488,800 | $194,700 | $294,100 |
| 2015 | $4,758 | $392,900 | $161,300 | $231,600 |
| 2014 | $4,412 | $350,700 | $161,300 | $189,400 |
Source: Public Records
Map
Nearby Homes
- 43 Robinson St Unit 3
- 15 Duncan St
- 69 Mount Ida Rd Unit 1
- 53 Mount Ida Rd Unit 1
- 40 Linden St Unit C
- 18 Lyon St Unit 2
- 7 Fox St Unit 1
- 8 Ridgewood St
- 98 Topliff St
- 33 Adams St Unit 3
- 33 Adams St Unit 1
- 83 Topliff St
- 23 Tonawanda St
- 19 Mount Ida Rd
- 41 Holiday St
- 32 Gibson St Unit 3
- 113 Dakota St
- 32 Beach St Unit 1
- 1 Dever St
- 9 Park St Unit 8
- 38 Robinson St
- 40 Robinson St
- 40 Robinson St Unit 3
- 40 Robinson St Unit 1
- 36 Robinson St
- 36 Robinson St Unit 3
- 17 Corwin St Unit 19
- 17 Corwin St Unit 3
- 17-19 Corwin St
- 17 Corwin St Unit 1
- 17-19 Corwin St Unit 1
- 17-19 Corwin St Unit 2
- 32 Robinson St
- 32 Robinson St Unit 1
- 42 Robinson St Unit 44
- 15 Corwin St Unit 15A
- 15 Corwin St Unit 2
- 20 Montello St
- 20 Montello St Unit 2
- 22 Montello St Unit 3