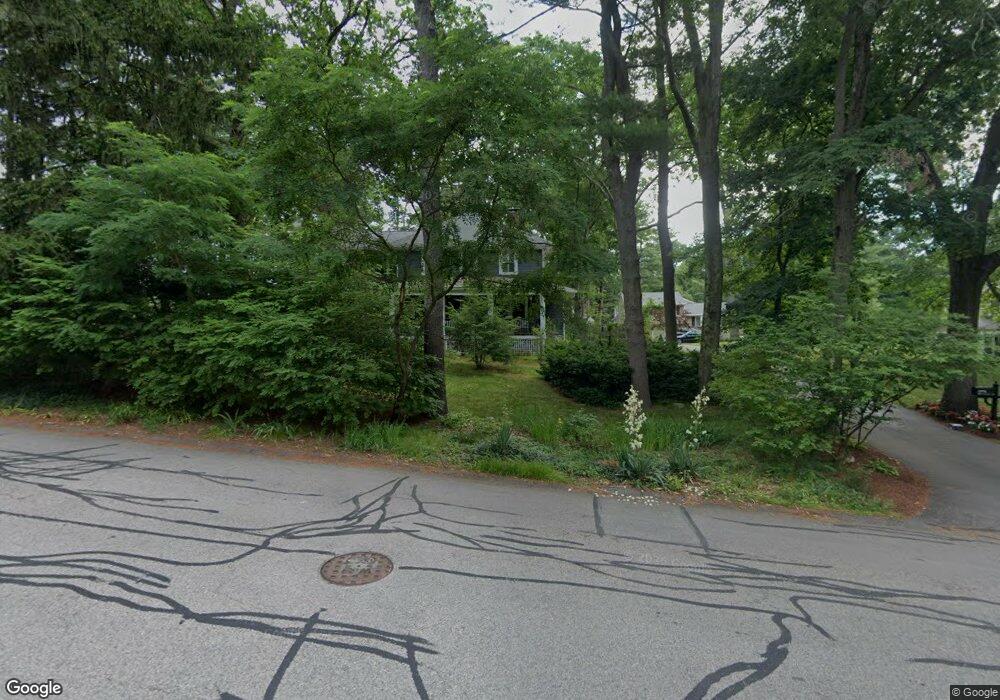
38 Russell Rd Wellesley, MA 02482
Estimated Value: $1,132,000 - $1,593,888
4
Beds
3
Baths
2,232
Sq Ft
$607/Sq Ft
Est. Value
About This Home
This home is located at 38 Russell Rd, Wellesley, MA 02482 and is currently estimated at $1,354,222, approximately $606 per square foot. 38 Russell Rd is a home located in Norfolk County with nearby schools including John D. Hardy Elementary School, Wellesley Middle School, and Wellesley Sr High School.
Ownership History
Date
Name
Owned For
Owner Type
Purchase Details
Closed on
Aug 23, 2002
Sold by
Burguess Joan F
Bought by
Medley Quintus G
Current Estimated Value
Create a Home Valuation Report for This Property
The Home Valuation Report is an in-depth analysis detailing your home's value as well as a comparison with similar homes in the area
Home Values in the Area
Average Home Value in this Area
Purchase History
| Date | Buyer | Sale Price | Title Company |
|---|---|---|---|
| Medley Quintus G | $500,000 | -- |
Source: Public Records
Tax History Compared to Growth
Tax History
| Year | Tax Paid | Tax Assessment Tax Assessment Total Assessment is a certain percentage of the fair market value that is determined by local assessors to be the total taxable value of land and additions on the property. | Land | Improvement |
|---|---|---|---|---|
| 2025 | $13,405 | $1,304,000 | $989,000 | $315,000 |
| 2024 | $12,534 | $1,204,000 | $899,000 | $305,000 |
| 2023 | $12,332 | $1,077,000 | $797,000 | $280,000 |
| 2022 | $11,248 | $963,000 | $684,000 | $279,000 |
| 2021 | $10,963 | $933,000 | $654,000 | $279,000 |
| 2020 | $10,785 | $933,000 | $654,000 | $279,000 |
| 2019 | $10,448 | $903,000 | $624,000 | $279,000 |
| 2018 | $10,325 | $864,000 | $620,000 | $244,000 |
| 2017 | $10,187 | $864,000 | $620,000 | $244,000 |
| 2016 | $9,985 | $844,000 | $609,000 | $235,000 |
| 2015 | $9,445 | $817,000 | $580,000 | $237,000 |
Source: Public Records
Map
Nearby Homes
- 9 Stonecleve Rd
- 12 Russell Rd Unit 405
- 847 Worcester St
- 18 Patton Rd
- 365 Weston Rd
- 6 Wilde Rd
- 23 Pilgrim Rd
- 13 Cavanaugh Rd
- 4 Shore Rd
- 3 Bacon St
- 50 Parker Rd
- 3 Pineridge Rd
- 115 Parker Rd
- 428 Weston Rd
- 6 Norwich Rd
- 17 Overbrook Terrace
- 148 Weston Rd Unit 208
- 148 Weston Rd Unit 207
- 200 Pond Rd
- 50 Upson Rd