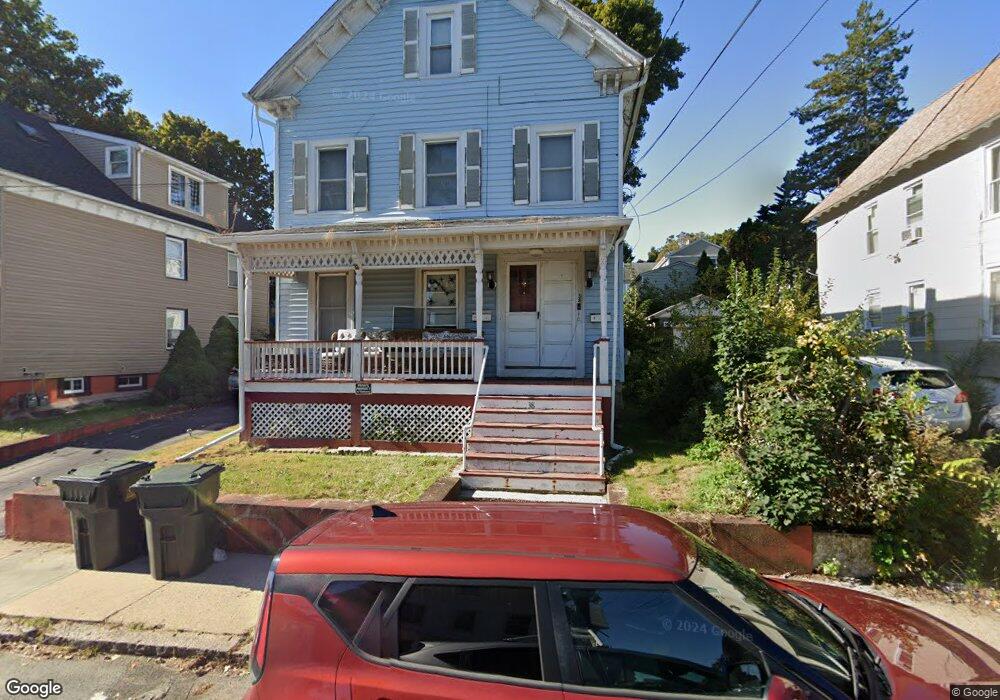
38 Spring St New London, CT 06320
Jefferson NeighborhoodEstimated Value: $269,000 - $355,000
6
Beds
2
Baths
2,712
Sq Ft
$114/Sq Ft
Est. Value
About This Home
This home is located at 38 Spring St, New London, CT 06320 and is currently estimated at $308,679, approximately $113 per square foot. 38 Spring St is a home located in New London County with nearby schools including Harbor Elementary School, Bennie Dover Jackson Middle School, and New London High School.
Ownership History
Date
Name
Owned For
Owner Type
Purchase Details
Closed on
May 2, 2003
Sold by
Royal Robert B
Bought by
Bowe Michael
Current Estimated Value
Purchase Details
Closed on
Feb 27, 2001
Sold by
Orourke Thomas F
Bought by
Royal Robert B
Purchase Details
Closed on
Dec 8, 1997
Sold by
Brown Robert M
Bought by
Orourk Thomas F
Purchase Details
Closed on
Mar 31, 1993
Sold by
Duval John J and Wright Donald L
Bought by
Brown Robert M
Create a Home Valuation Report for This Property
The Home Valuation Report is an in-depth analysis detailing your home's value as well as a comparison with similar homes in the area
Home Values in the Area
Average Home Value in this Area
Purchase History
| Date | Buyer | Sale Price | Title Company |
|---|---|---|---|
| Bowe Michael | $159,000 | -- | |
| Bowe Michael | $159,000 | -- | |
| Royal Robert B | $123,600 | -- | |
| Royal Robert B | $123,600 | -- | |
| Orourk Thomas F | $100,000 | -- | |
| Orourk Thomas F | $100,000 | -- | |
| Brown Robert M | $90,000 | -- | |
| Brown Robert M | $90,000 | -- |
Source: Public Records
Mortgage History
| Date | Status | Borrower | Loan Amount |
|---|---|---|---|
| Open | Brown Robert M | $208,000 | |
| Closed | Brown Robert M | $164,800 |
Source: Public Records
Tax History Compared to Growth
Tax History
| Year | Tax Paid | Tax Assessment Tax Assessment Total Assessment is a certain percentage of the fair market value that is determined by local assessors to be the total taxable value of land and additions on the property. | Land | Improvement |
|---|---|---|---|---|
| 2025 | $4,159 | $152,900 | $40,100 | $112,800 |
| 2024 | $4,205 | $152,900 | $40,100 | $112,800 |
| 2023 | $3,842 | $103,180 | $32,060 | $71,120 |
| 2022 | $3,850 | $103,180 | $32,060 | $71,120 |
| 2021 | $3,916 | $103,180 | $32,060 | $71,120 |
| 2020 | $3,940 | $103,180 | $32,060 | $71,120 |
| 2019 | $4,117 | $103,180 | $32,060 | $71,120 |
| 2018 | $3,833 | $87,640 | $30,800 | $56,840 |
| 2017 | $3,879 | $87,640 | $30,800 | $56,840 |
| 2016 | $3,546 | $87,640 | $30,800 | $56,840 |
| 2015 | $3,461 | $87,640 | $30,800 | $56,840 |
| 2014 | $3,003 | $87,640 | $30,800 | $56,840 |
Source: Public Records
Map
Nearby Homes
- 26 Jefferson Ave
- 835 Bank St
- 77 Colman St
- 49 Belden St
- 55 Connecticut Ave
- 59 Connecticut Ave
- 38 Mountain Ave
- 2 Faye St
- 32 Moore Ave
- 18 W Pleasant St
- 142 Montauk Ave
- 152 Blydenburg Ave
- 2 Coit St Unit 1
- 19 Clover Ct
- 7 Coit St Unit 2
- 9 Brewer St Unit 3
- 9 Brewer St Unit 1
- 9 Brewer St Unit 2
- 9 Brewer St
- 400 Bank St Unit 105