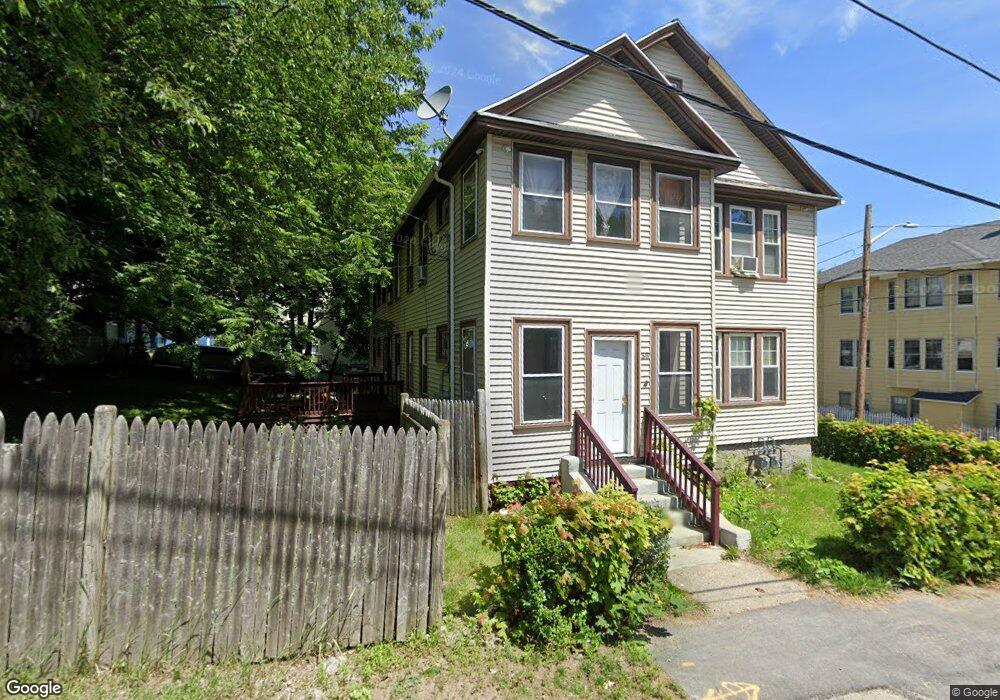
38 Stebbins St Worcester, MA 01607
North Quinsigamond Village NeighborhoodEstimated Value: $438,000 - $574,000
6
Beds
2
Baths
2,908
Sq Ft
$177/Sq Ft
Est. Value
About This Home
This home is located at 38 Stebbins St, Worcester, MA 01607 and is currently estimated at $514,189, approximately $176 per square foot. 38 Stebbins St is a home located in Worcester County with nearby schools including Quinsigamond School, Jacob Hiatt Magnet School, and Chandler Magnet.
Ownership History
Date
Name
Owned For
Owner Type
Purchase Details
Closed on
Nov 22, 2011
Sold by
Fnma
Bought by
Barake Hussein I and Maalin Maryan O
Current Estimated Value
Home Financials for this Owner
Home Financials are based on the most recent Mortgage that was taken out on this home.
Original Mortgage
$171,936
Outstanding Balance
$116,676
Interest Rate
3.92%
Mortgage Type
Purchase Money Mortgage
Estimated Equity
$397,513
Purchase Details
Closed on
May 20, 2011
Sold by
Orlans Moran Pllc
Bought by
Federal National Mortgage Association
Purchase Details
Closed on
Aug 9, 1995
Sold by
Trombi Rita A
Bought by
Ruksnaitis William and Ruksnaitis Sally
Home Financials for this Owner
Home Financials are based on the most recent Mortgage that was taken out on this home.
Original Mortgage
$77,000
Interest Rate
7.48%
Mortgage Type
Purchase Money Mortgage
Create a Home Valuation Report for This Property
The Home Valuation Report is an in-depth analysis detailing your home's value as well as a comparison with similar homes in the area
Home Values in the Area
Average Home Value in this Area
Purchase History
| Date | Buyer | Sale Price | Title Company |
|---|---|---|---|
| Barake Hussein I | $172,000 | -- | |
| Federal National Mortgage Association | $185,041 | -- | |
| Ruksnaitis William | $110,000 | -- |
Source: Public Records
Mortgage History
| Date | Status | Borrower | Loan Amount |
|---|---|---|---|
| Open | Barake Hussein I | $171,936 | |
| Previous Owner | Ruksnaitis William | $77,000 |
Source: Public Records
Tax History
| Year | Tax Paid | Tax Assessment Tax Assessment Total Assessment is a certain percentage of the fair market value that is determined by local assessors to be the total taxable value of land and additions on the property. | Land | Improvement |
|---|---|---|---|---|
| 2025 | $6,654 | $504,500 | $117,700 | $386,800 |
| 2024 | $6,358 | $462,400 | $117,700 | $344,700 |
| 2023 | $5,942 | $414,400 | $102,300 | $312,100 |
| 2022 | $5,470 | $359,600 | $81,900 | $277,700 |
| 2021 | $5,031 | $309,000 | $65,500 | $243,500 |
| 2020 | $4,743 | $279,000 | $65,500 | $213,500 |
| 2019 | $4,759 | $264,400 | $58,900 | $205,500 |
| 2018 | $4,675 | $247,200 | $58,900 | $188,300 |
| 2017 | $4,469 | $232,500 | $58,900 | $173,600 |
| 2016 | $4,404 | $213,700 | $42,900 | $170,800 |
| 2015 | $4,289 | $213,700 | $42,900 | $170,800 |
| 2014 | $4,176 | $213,700 | $42,900 | $170,800 |
Source: Public Records
Map
Nearby Homes
- 42 Stebbins St
- 6 Malmo St
- 34 Stebbins St
- 34 Stebbins St Unit 3
- 1 Thenius St
- 27 Bothnia St
- 15 Malmo St
- 4 Thenius St Unit 3
- 4 Thenius St
- 4 Malmo St
- 2 Thenius St Unit 1
- 33 Stebbins St
- 7 Thenius St
- 7 Thenius St Unit 2
- 28 Stebbins St
- 37 Stebbins St
- 5 Thenius St Unit 2
- 31 Stebbins St
- 45 Butler St
- 51 Butler St
Your Personal Tour Guide
Ask me questions while you tour the home.