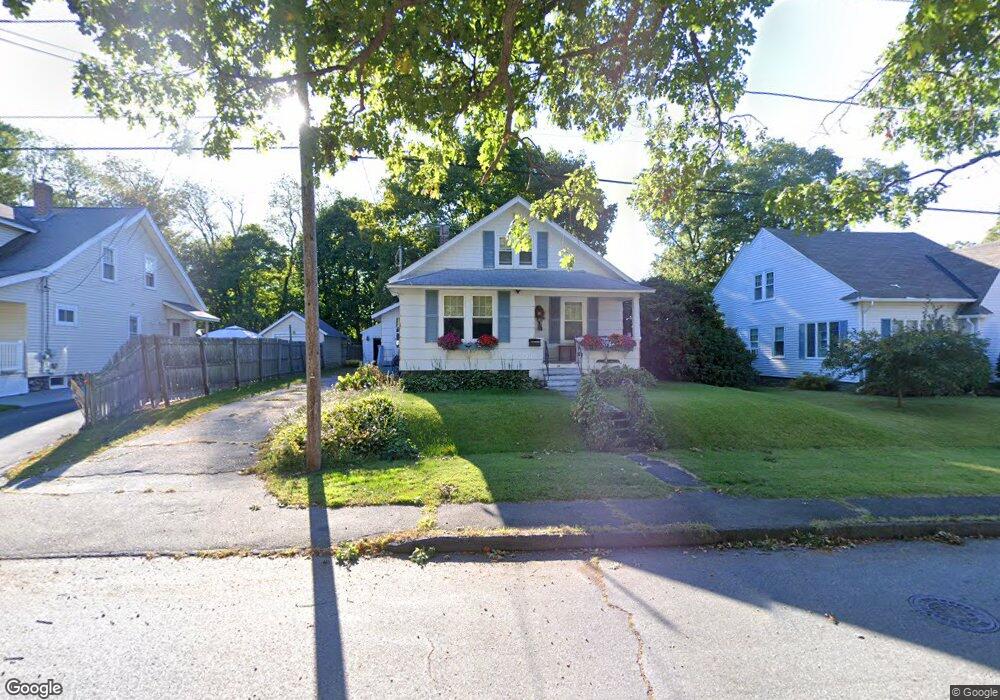
38 Sumner St Auburn, MA 01501
Stoneville NeighborhoodEstimated Value: $370,000 - $431,000
3
Beds
2
Baths
1,241
Sq Ft
$317/Sq Ft
Est. Value
About This Home
This home is located at 38 Sumner St, Auburn, MA 01501 and is currently estimated at $393,154, approximately $316 per square foot. 38 Sumner St is a home located in Worcester County with nearby schools including Auburn Senior High School and Shrewsbury Montessori School - Auburn Campus.
Ownership History
Date
Name
Owned For
Owner Type
Purchase Details
Closed on
Dec 1, 1993
Sold by
Provost Frederick J and Provost Mary
Bought by
Prouty Mark S
Current Estimated Value
Home Financials for this Owner
Home Financials are based on the most recent Mortgage that was taken out on this home.
Original Mortgage
$63,819
Interest Rate
6.69%
Mortgage Type
Purchase Money Mortgage
Create a Home Valuation Report for This Property
The Home Valuation Report is an in-depth analysis detailing your home's value as well as a comparison with similar homes in the area
Home Values in the Area
Average Home Value in this Area
Purchase History
| Date | Buyer | Sale Price | Title Company |
|---|---|---|---|
| Prouty Mark S | $73,000 | -- |
Source: Public Records
Mortgage History
| Date | Status | Borrower | Loan Amount |
|---|---|---|---|
| Closed | Prouty Mark S | $63,819 | |
| Previous Owner | Prouty Mark S | $65,372 | |
| Previous Owner | Prouty Mark S | $46,399 |
Source: Public Records
Tax History
| Year | Tax Paid | Tax Assessment Tax Assessment Total Assessment is a certain percentage of the fair market value that is determined by local assessors to be the total taxable value of land and additions on the property. | Land | Improvement |
|---|---|---|---|---|
| 2025 | $42 | $293,600 | $112,800 | $180,800 |
| 2024 | $4,124 | $276,200 | $106,900 | $169,300 |
| 2023 | $4,086 | $257,300 | $97,100 | $160,200 |
| 2022 | $3,808 | $226,400 | $97,100 | $129,300 |
| 2021 | $3,425 | $188,800 | $85,700 | $103,100 |
| 2020 | $3,377 | $187,800 | $85,700 | $102,100 |
| 2019 | $3,373 | $183,100 | $84,800 | $98,300 |
| 2018 | $3,177 | $172,300 | $79,300 | $93,000 |
| 2017 | $2,995 | $163,300 | $71,900 | $91,400 |
| 2016 | $2,855 | $157,800 | $75,100 | $82,700 |
| 2015 | $2,649 | $153,500 | $75,100 | $78,400 |
| 2014 | $2,704 | $156,400 | $71,500 | $84,900 |
Source: Public Records
Map
Nearby Homes
- 99 Clover St
- 5 Commonwealth Ave
- 177 Boyce St
- 25 Vinal St Unit 28
- 25 Vinal St Unit 26
- 25 Vinal St Unit 29
- 25 Vinal St Unit 30
- 1 Rockland Road Ct
- 177 Oxford St N
- 11 Hulbert Rd Unit 13
- 204-212 Hampton St
- 1034 Southbridge St
- 103 Henshaw St
- 27 Havana Rd
- 84 Eureka St
- 31-33 Walsh Ave
- 33 Walsh Ave
- 31 Walsh Ave
- 154 Pakachoag St
- 19-20 Williams St
Your Personal Tour Guide
Ask me questions while you tour the home.