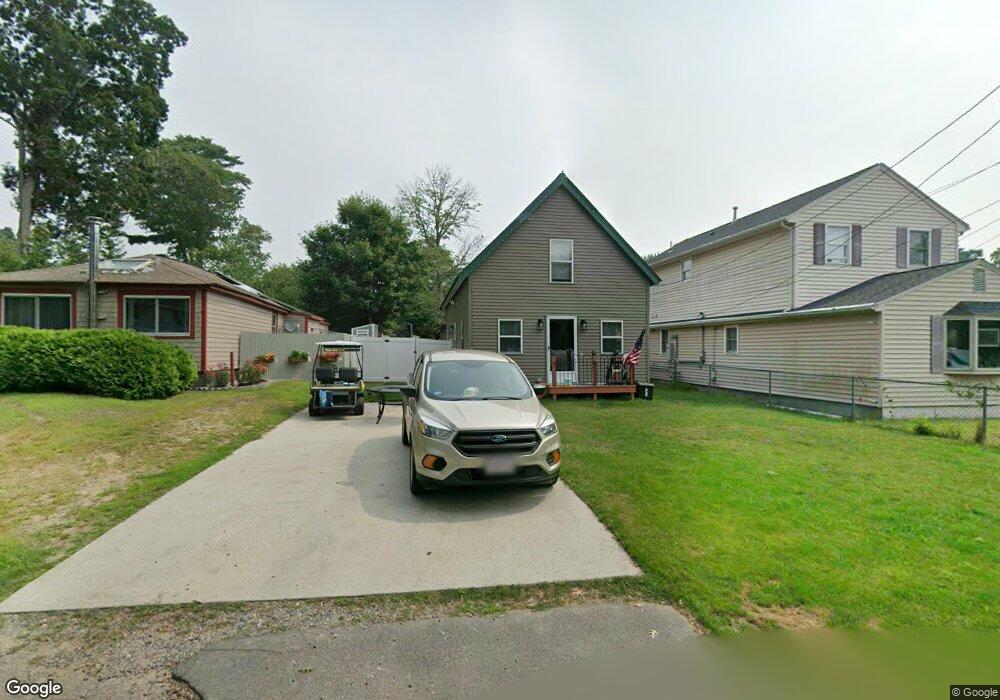
38 Sunset Rd Norton, MA 02766
Estimated Value: $433,000 - $515,000
2
Beds
2
Baths
1,485
Sq Ft
$314/Sq Ft
Est. Value
About This Home
This home is located at 38 Sunset Rd, Norton, MA 02766 and is currently estimated at $466,961, approximately $314 per square foot. 38 Sunset Rd is a home located in Bristol County with nearby schools including J.C. Solmonese Elementary School, Henri A. Yelle Elementary School, and Norton Middle School.
Ownership History
Date
Name
Owned For
Owner Type
Purchase Details
Closed on
Nov 23, 2022
Sold by
Billotte David M
Bought by
Billotte David M and Billotte Taylor R
Current Estimated Value
Home Financials for this Owner
Home Financials are based on the most recent Mortgage that was taken out on this home.
Original Mortgage
$275,000
Outstanding Balance
$265,637
Interest Rate
6.95%
Mortgage Type
New Conventional
Estimated Equity
$201,324
Purchase Details
Closed on
Aug 21, 2022
Sold by
Billotte David J
Bought by
Billotte David J
Purchase Details
Closed on
Oct 13, 1987
Sold by
Masci Steven C
Bought by
Billotte David J
Home Financials for this Owner
Home Financials are based on the most recent Mortgage that was taken out on this home.
Original Mortgage
$67,500
Interest Rate
10.33%
Mortgage Type
Purchase Money Mortgage
Create a Home Valuation Report for This Property
The Home Valuation Report is an in-depth analysis detailing your home's value as well as a comparison with similar homes in the area
Home Values in the Area
Average Home Value in this Area
Purchase History
| Date | Buyer | Sale Price | Title Company |
|---|---|---|---|
| Billotte David M | -- | None Available | |
| Billotte David M | -- | None Available | |
| Billotte David J | -- | None Available | |
| Billotte David J | -- | None Available | |
| Billotte David J | $75,000 | -- |
Source: Public Records
Mortgage History
| Date | Status | Borrower | Loan Amount |
|---|---|---|---|
| Open | Billotte David M | $275,000 | |
| Closed | Billotte David M | $275,000 | |
| Previous Owner | Billotte David J | $75,000 | |
| Previous Owner | Billotte David J | $67,500 |
Source: Public Records
Tax History
| Year | Tax Paid | Tax Assessment Tax Assessment Total Assessment is a certain percentage of the fair market value that is determined by local assessors to be the total taxable value of land and additions on the property. | Land | Improvement |
|---|---|---|---|---|
| 2025 | $51 | $395,700 | $157,000 | $238,700 |
| 2024 | $4,753 | $367,000 | $149,500 | $217,500 |
| 2023 | $4,536 | $349,200 | $141,000 | $208,200 |
| 2022 | $4,392 | $308,000 | $128,200 | $179,800 |
| 2021 | $4,162 | $278,800 | $122,100 | $156,700 |
| 2020 | $3,675 | $272,800 | $118,500 | $154,300 |
| 2019 | $3,607 | $262,500 | $114,000 | $148,500 |
| 2018 | $3,626 | $239,200 | $107,700 | $131,500 |
| 2017 | $3,527 | $229,500 | $107,700 | $121,800 |
| 2016 | $3,337 | $213,800 | $101,400 | $112,400 |
| 2015 | $3,220 | $209,200 | $99,400 | $109,800 |
| 2014 | $3,063 | $199,300 | $94,600 | $104,700 |
Source: Public Records
Map
Nearby Homes
- 268 Reservoir St
- 0 Brook Pkwy
- 21 Juniper Rd
- 0 Cobb St
- 93 Mansfield Ave
- 157 Mansfield Ave Unit 14
- 19 Barberry Rd
- 95 Godfrey Dr
- 250 Mansfield Ave Unit 11
- 65 Godfrey Dr Unit 65
- 343 Godfrey Dr
- 1 Wilbur Terrace Unit 6
- 5 Robin Cir Unit 5
- 0 S Washington St Unit 73437419
- 0 Kensington Rd
- 14 Windchime Dr
- 195 E Main St
- 20 Lloyd Cir Unit 32
- 14 Lloyd Cir Unit 29
- 35 Owen Rd
Your Personal Tour Guide
Ask me questions while you tour the home.