38 Via Rubino Newport Coast, CA 92657
Newport Coast NeighborhoodEstimated Value: $7,126,467 - $7,787,000
4
Beds
5
Baths
4,309
Sq Ft
$1,708/Sq Ft
Est. Value
About This Home
This home is located at 38 Via Rubino, Newport Coast, CA 92657 and is currently estimated at $7,359,489, approximately $1,707 per square foot. 38 Via Rubino is a home located in Orange County with nearby schools including Newport Coast Elementary School, Corona del Mar Middle and High School, and Harbor Day School.
Ownership History
Date
Name
Owned For
Owner Type
Purchase Details
Closed on
Nov 18, 2015
Sold by
Buchwald Aaron W
Bought by
Buchwald Aaron W and Aaron W Buchwald Living Trust
Current Estimated Value
Purchase Details
Closed on
Jul 16, 1999
Sold by
Taylor Woodrow Homes Inc
Bought by
Buchwald Aaron W and Buchwald Daphne Law
Create a Home Valuation Report for This Property
The Home Valuation Report is an in-depth analysis detailing your home's value as well as a comparison with similar homes in the area
Home Values in the Area
Average Home Value in this Area
Purchase History
| Date | Buyer | Sale Price | Title Company |
|---|---|---|---|
| Buchwald Aaron W | -- | None Available | |
| Buchwald Aaron W | -- | None Available | |
| Buchwald Aaron W | -- | First American Title Co |
Source: Public Records
Tax History Compared to Growth
Tax History
| Year | Tax Paid | Tax Assessment Tax Assessment Total Assessment is a certain percentage of the fair market value that is determined by local assessors to be the total taxable value of land and additions on the property. | Land | Improvement |
|---|---|---|---|---|
| 2025 | $21,458 | $2,016,391 | $968,895 | $1,047,496 |
| 2024 | $21,458 | $1,976,854 | $949,897 | $1,026,957 |
| 2023 | $21,035 | $1,938,093 | $931,272 | $1,006,821 |
| 2022 | $20,683 | $1,900,092 | $913,012 | $987,080 |
| 2021 | $19,725 | $1,862,836 | $895,110 | $967,726 |
| 2020 | $20,201 | $1,843,735 | $885,931 | $957,804 |
| 2019 | $19,974 | $1,807,584 | $868,560 | $939,024 |
| 2018 | $19,586 | $1,772,142 | $851,530 | $920,612 |
| 2017 | $20,092 | $1,737,395 | $834,834 | $902,561 |
| 2016 | $21,608 | $1,703,329 | $818,465 | $884,864 |
| 2015 | $21,416 | $1,677,744 | $806,171 | $871,573 |
| 2014 | $20,941 | $1,644,880 | $790,379 | $854,501 |
Source: Public Records
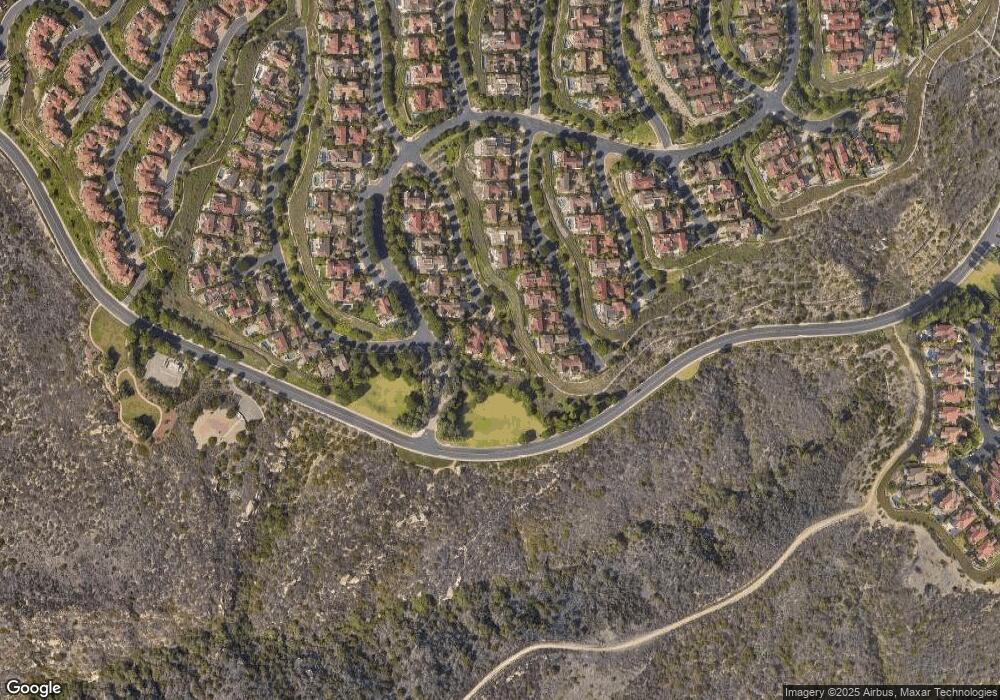
Map
Nearby Homes