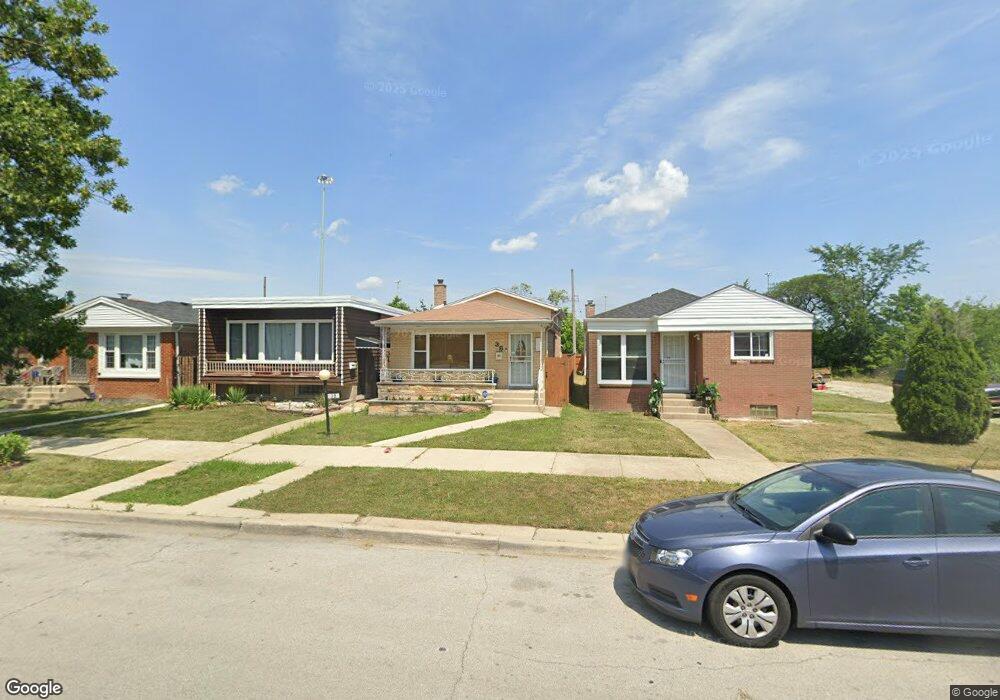
38 W 99th St Chicago, IL 60628
Roseland NeighborhoodEstimated Value: $173,000 - $204,000
3
Beds
2
Baths
1,000
Sq Ft
$188/Sq Ft
Est. Value
About This Home
This home is located at 38 W 99th St, Chicago, IL 60628 and is currently estimated at $187,826, approximately $187 per square foot. 38 W 99th St is a home located in Cook County with nearby schools including Langston Hughes STEM Elementary School, Harlan Community Academy High School, and Christian S T E M Scholars.
Ownership History
Date
Name
Owned For
Owner Type
Purchase Details
Closed on
Dec 23, 2009
Sold by
Threatt Tyrone
Bought by
Goss Shevelle
Current Estimated Value
Home Financials for this Owner
Home Financials are based on the most recent Mortgage that was taken out on this home.
Original Mortgage
$121,688
Outstanding Balance
$78,882
Interest Rate
4.78%
Mortgage Type
New Conventional
Estimated Equity
$108,944
Purchase Details
Closed on
Jul 2, 2009
Sold by
Us Bank National Association
Bought by
Threatt Tyrone
Purchase Details
Closed on
Nov 24, 2008
Sold by
Kennedy Joseph
Bought by
Us Bank National Association
Purchase Details
Closed on
Aug 23, 2004
Sold by
Spencer Leslie F
Bought by
Kennedy Joseph
Purchase Details
Closed on
Oct 26, 2000
Sold by
Spencer Leslie F
Bought by
Spencer Leslie and Spencer Nancy L
Home Financials for this Owner
Home Financials are based on the most recent Mortgage that was taken out on this home.
Original Mortgage
$100,800
Interest Rate
9.75%
Create a Home Valuation Report for This Property
The Home Valuation Report is an in-depth analysis detailing your home's value as well as a comparison with similar homes in the area
Home Values in the Area
Average Home Value in this Area
Purchase History
| Date | Buyer | Sale Price | Title Company |
|---|---|---|---|
| Goss Shevelle | $152,500 | Attorneys Title Guaranty Fun | |
| Threatt Tyrone | $42,000 | Premier Title Company | |
| Us Bank National Association | -- | None Available | |
| Kennedy Joseph | $154,000 | Multiple | |
| Spencer Leslie | -- | -- |
Source: Public Records
Mortgage History
| Date | Status | Borrower | Loan Amount |
|---|---|---|---|
| Open | Goss Shevelle | $121,688 | |
| Previous Owner | Spencer Leslie | $100,800 |
Source: Public Records
Tax History Compared to Growth
Tax History
| Year | Tax Paid | Tax Assessment Tax Assessment Total Assessment is a certain percentage of the fair market value that is determined by local assessors to be the total taxable value of land and additions on the property. | Land | Improvement |
|---|---|---|---|---|
| 2024 | $2,260 | $11,000 | $2,969 | $8,031 |
| 2023 | $2,182 | $14,000 | $2,344 | $11,656 |
| 2022 | $2,182 | $14,000 | $2,344 | $11,656 |
| 2021 | $2,151 | $13,999 | $2,343 | $11,656 |
| 2020 | $1,784 | $11,091 | $2,343 | $8,748 |
| 2019 | $1,764 | $12,188 | $2,343 | $9,845 |
| 2018 | $1,733 | $12,188 | $2,343 | $9,845 |
| 2017 | $1,644 | $10,997 | $2,031 | $8,966 |
| 2016 | $1,706 | $10,997 | $2,031 | $8,966 |
| 2015 | $1,538 | $10,997 | $2,031 | $8,966 |
| 2014 | $1,521 | $10,748 | $1,875 | $8,873 |
| 2013 | $2,024 | $13,732 | $1,875 | $11,857 |
Source: Public Records
Map
Nearby Homes
- 9930 S Perry Ave
- 9919 S Wentworth Ave
- 10012 S Lafayette Ave
- 10018 S State St
- 10015 S State St
- 9745 S Wentworth Ave
- 10001 S Wentworth Ave
- 10037 S State St
- 10052 S Lafayette Ave
- 10044 S La Salle St
- 10020 S Wentworth Ave
- 70 E 100th Place
- 10102 S La Salle St
- 10016 S Yale Ave
- 10117 S Perry Ave
- 9727 S Michigan Ave
- 10112 S La Salle St
- 10015 S Princeton Ave
- 26 E 101st Place
- 10119 S Wentworth Ave
- 40 W 99th St
- 42 W 99th St
- 44 W 99th St
- 50 W 99th St
- 52 W 99th St
- 9900 S Lafayette Ave
- 9902 S Lafayette Ave
- 56 W 99th St
- 58 W 99th St
- 9901 S Perry Ave
- 9901 S Lafayette Ave
- 9905 S Perry Ave
- 9907 S Lafayette Ave
- 9907 S Perry Ave
- 9909 S Lafayette Ave
- 9909 S Perry Ave
- 9916 S Lafayette Ave
- 9916 S Lafayette Ave
- 9911 S Lafayette Ave