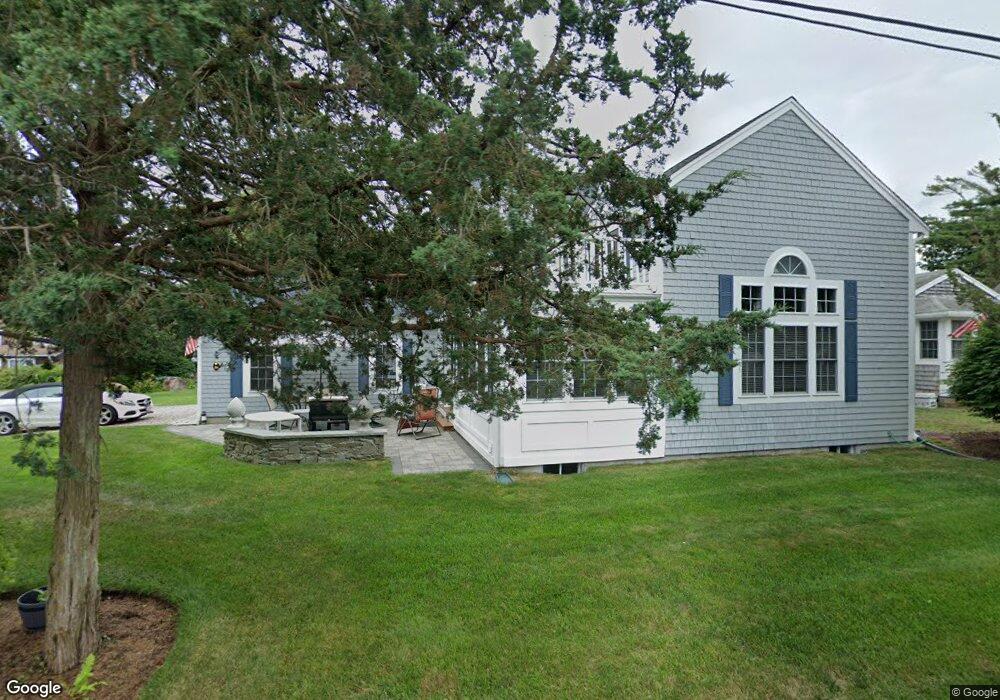
38 Wamsutta Ave Pocasset, MA 02559
Pocasset NeighborhoodEstimated Value: $876,000 - $1,041,000
3
Beds
2
Baths
650
Sq Ft
$1,494/Sq Ft
Est. Value
About This Home
This home is located at 38 Wamsutta Ave, Pocasset, MA 02559 and is currently estimated at $971,249, approximately $1,494 per square foot. 38 Wamsutta Ave is a home located in Barnstable County with nearby schools including Bourne High School and Cadence Academy Preschool - Bourne.
Ownership History
Date
Name
Owned For
Owner Type
Purchase Details
Closed on
Nov 29, 2021
Sold by
George Sharon A
Bought by
Sharon A George T A and Sharon George
Current Estimated Value
Purchase Details
Closed on
May 24, 2002
Sold by
King Paul F
Bought by
George Sharon A
Purchase Details
Closed on
Jan 29, 2002
Sold by
Moore John R and Moore Ann M
Bought by
King Paul F
Home Financials for this Owner
Home Financials are based on the most recent Mortgage that was taken out on this home.
Original Mortgage
$40,000
Interest Rate
7.08%
Mortgage Type
Purchase Money Mortgage
Create a Home Valuation Report for This Property
The Home Valuation Report is an in-depth analysis detailing your home's value as well as a comparison with similar homes in the area
Home Values in the Area
Average Home Value in this Area
Purchase History
| Date | Buyer | Sale Price | Title Company |
|---|---|---|---|
| Sharon A George T A | -- | None Available | |
| Sharon A George T A | -- | None Available | |
| George Sharon A | $140,000 | -- | |
| George Sharon A | $140,000 | -- | |
| King Paul F | $70,000 | -- | |
| King Paul F | $70,000 | -- |
Source: Public Records
Mortgage History
| Date | Status | Borrower | Loan Amount |
|---|---|---|---|
| Previous Owner | King Paul F | $40,000 |
Source: Public Records
Tax History Compared to Growth
Tax History
| Year | Tax Paid | Tax Assessment Tax Assessment Total Assessment is a certain percentage of the fair market value that is determined by local assessors to be the total taxable value of land and additions on the property. | Land | Improvement |
|---|---|---|---|---|
| 2025 | $6,252 | $800,500 | $374,100 | $426,400 |
| 2024 | $6,152 | $767,100 | $356,300 | $410,800 |
| 2023 | $6,017 | $683,000 | $315,300 | $367,700 |
| 2022 | $5,474 | $542,500 | $247,300 | $295,200 |
| 2021 | $5,352 | $496,900 | $225,100 | $271,800 |
| 2020 | $5,217 | $485,800 | $222,900 | $262,900 |
| 2019 | $4,979 | $473,700 | $222,900 | $250,800 |
| 2018 | $4,842 | $459,400 | $217,800 | $241,600 |
| 2017 | $4,685 | $454,900 | $215,700 | $239,200 |
| 2016 | $4,448 | $437,800 | $205,000 | $232,800 |
| 2015 | $4,899 | $486,500 | $188,800 | $297,700 |
Source: Public Records
Map
Nearby Homes
- 171 Bellavista Dr
- 22 Nairn Rd
- 34 Kenwood Rd
- 254 Barlows Landing Rd
- 45 Kenwood Rd
- 48 Red Brook Harbor Rd
- 70 Wings Neck Rd
- 3 Red Brook Pond Dr
- 940 County Rd
- 1094 County Rd
- 24 Richmond Rd
- 940 County Rd
- 709 County Rd
- 14 Navajo Rd
- 174 Barlows Landing Rd
- 7 4th Ave
- 15 1st St
- 89 Harbor Dr
- 39 Bennets Neck Dr
- 7 Portside Dr