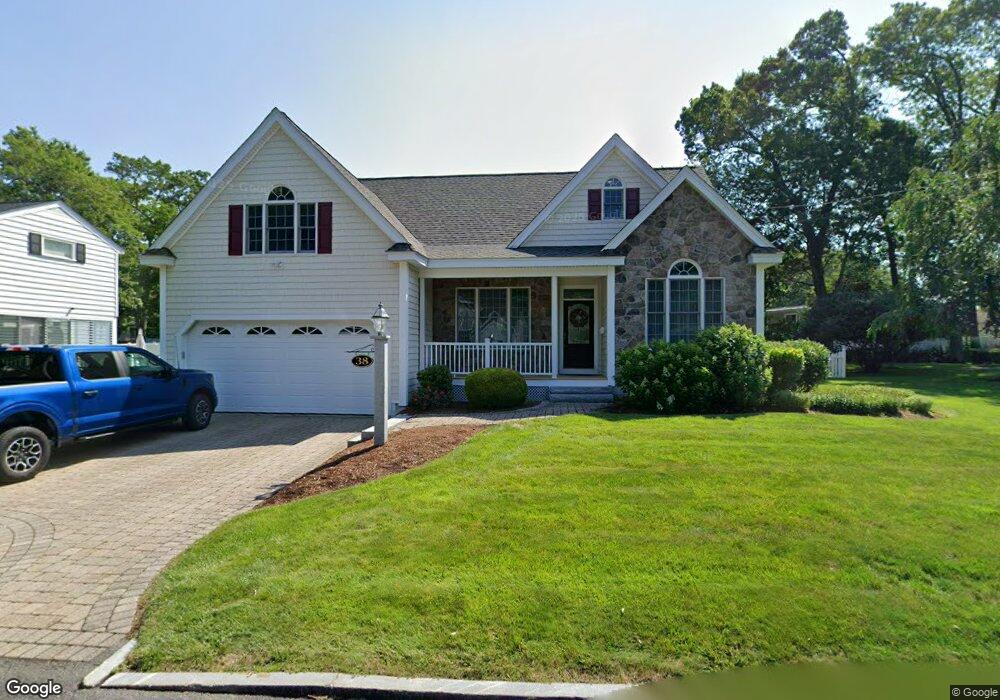
38 Westview Rd Lowell, MA 01851
Highlands NeighborhoodEstimated Value: $619,000 - $768,000
2
Beds
2
Baths
2,156
Sq Ft
$325/Sq Ft
Est. Value
About This Home
This home is located at 38 Westview Rd, Lowell, MA 01851 and is currently estimated at $700,457, approximately $324 per square foot. 38 Westview Rd is a home located in Middlesex County with nearby schools including Charles W. Morey Elementary School, Dr. Gertrude Bailey Elementary School, and Abraham Lincoln Elementary School.
Ownership History
Date
Name
Owned For
Owner Type
Purchase Details
Closed on
Aug 15, 2003
Sold by
Joseph Peter S
Bought by
Conners Dennis and Conners Lee Ann
Current Estimated Value
Home Financials for this Owner
Home Financials are based on the most recent Mortgage that was taken out on this home.
Original Mortgage
$264,000
Outstanding Balance
$114,899
Interest Rate
5.46%
Mortgage Type
Purchase Money Mortgage
Estimated Equity
$585,558
Create a Home Valuation Report for This Property
The Home Valuation Report is an in-depth analysis detailing your home's value as well as a comparison with similar homes in the area
Home Values in the Area
Average Home Value in this Area
Purchase History
| Date | Buyer | Sale Price | Title Company |
|---|---|---|---|
| Conners Dennis | $150,000 | -- | |
| Conners Dennis | $150,000 | -- |
Source: Public Records
Mortgage History
| Date | Status | Borrower | Loan Amount |
|---|---|---|---|
| Closed | Conners Dennis | $125,000 | |
| Closed | Conners Dennis | $100,000 | |
| Closed | Conners Dennis | $152,000 | |
| Open | Conners Dennis | $264,000 | |
| Closed | Conners Dennis | $264,000 |
Source: Public Records
Tax History
| Year | Tax Paid | Tax Assessment Tax Assessment Total Assessment is a certain percentage of the fair market value that is determined by local assessors to be the total taxable value of land and additions on the property. | Land | Improvement |
|---|---|---|---|---|
| 2025 | $7,992 | $696,200 | $214,700 | $481,500 |
| 2024 | $7,381 | $619,700 | $184,000 | $435,700 |
| 2023 | $7,545 | $607,500 | $160,000 | $447,500 |
| 2022 | $7,004 | $551,900 | $145,400 | $406,500 |
| 2021 | $6,608 | $490,900 | $126,500 | $364,400 |
| 2020 | $6,313 | $472,500 | $112,700 | $359,800 |
| 2019 | $6,377 | $454,200 | $112,900 | $341,300 |
| 2018 | $6,244 | $433,900 | $107,500 | $326,400 |
| 2017 | $5,962 | $399,600 | $97,700 | $301,900 |
| 2016 | $5,693 | $375,500 | $100,900 | $274,600 |
| 2015 | $5,656 | $365,400 | $97,400 | $268,000 |
| 2013 | $5,064 | $337,400 | $112,900 | $224,500 |
Source: Public Records
Map
Nearby Homes
- 142 Sanders Ave
- 694 Westford St
- 977 Westford St Unit 4
- 4 Tamarack St
- 137 Pine St Unit 11
- 45 Harvard St Unit 5 3rd fl
- 1311 Middlesex St
- 11 Warwick St Unit 3
- 94 D St
- 312 Wilder St
- 85 B St
- 138 W Forest St
- 49 Marginal St
- 108 Inland St
- 18 Burgess St
- 339 Pawtucket Blvd Unit 19
- 295 Pawtucket Blvd Unit 7
- 351 Pawtucket Blvd Unit 3
- 351 Pawtucket Blvd Unit 29
- 311 Pawtucket Blvd Unit 9
Your Personal Tour Guide
Ask me questions while you tour the home.