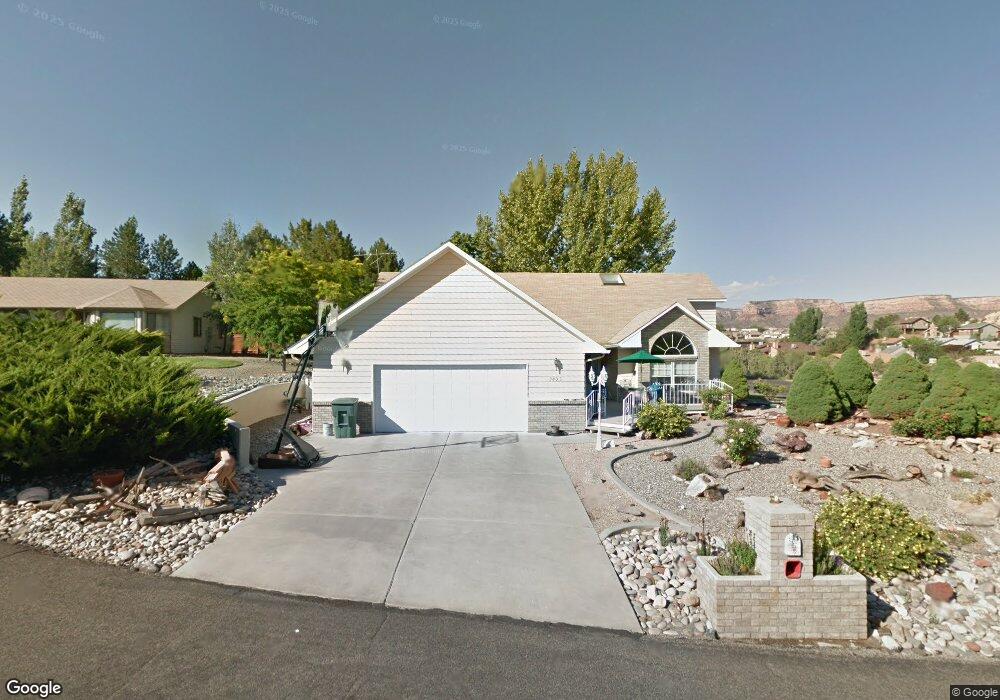
380 1/2 Cliff Rosa Ct Grand Junction, CO 81507
Redlands NeighborhoodEstimated Value: $543,000 - $634,000
3
Beds
2
Baths
2,076
Sq Ft
$283/Sq Ft
Est. Value
About This Home
This home is located at 380 1/2 Cliff Rosa Ct, Grand Junction, CO 81507 and is currently estimated at $587,187, approximately $282 per square foot. 380 1/2 Cliff Rosa Ct is a home located in Mesa County with nearby schools including Scenic Elementary School, Redlands Middle School, and Grand Junction High School.
Ownership History
Date
Name
Owned For
Owner Type
Purchase Details
Closed on
May 25, 1999
Sold by
Willcoxon Wanda B
Bought by
Worth Timothy B and Worth Sherry K
Current Estimated Value
Home Financials for this Owner
Home Financials are based on the most recent Mortgage that was taken out on this home.
Original Mortgage
$95,000
Outstanding Balance
$24,282
Interest Rate
6.91%
Estimated Equity
$562,905
Purchase Details
Closed on
Jan 21, 1994
Sold by
Bagg David P
Bought by
Worth Timothy B
Purchase Details
Closed on
Mar 25, 1993
Sold by
Johnson Kevin W
Bought by
Worth Sherry K
Purchase Details
Closed on
Jul 28, 1992
Sold by
Grand Junction City Of
Bought by
Worth Timothy B
Purchase Details
Closed on
Jul 14, 1992
Sold by
Ridges Metropolitan District
Bought by
Worth Sherry K
Purchase Details
Closed on
Dec 9, 1991
Sold by
Voytilla James L
Bought by
Worth Sherry K
Purchase Details
Closed on
Dec 4, 1991
Sold by
Inc 8 Parcels
Bought by
Worth Sherry K
Purchase Details
Closed on
Jan 24, 1990
Sold by
Valley Federal Savings & Loan Assoc
Bought by
Worth Sherry K
Create a Home Valuation Report for This Property
The Home Valuation Report is an in-depth analysis detailing your home's value as well as a comparison with similar homes in the area
Home Values in the Area
Average Home Value in this Area
Purchase History
| Date | Buyer | Sale Price | Title Company |
|---|---|---|---|
| Worth Timothy B | $166,400 | -- | |
| Worth Timothy B | $146,900 | -- | |
| Worth Sherry K | $16,000 | -- | |
| Worth Timothy B | -- | -- | |
| Worth Sherry K | -- | -- | |
| Worth Sherry K | $10,500 | -- | |
| Worth Sherry K | $32,200 | -- | |
| Worth Sherry K | $180,000 | -- |
Source: Public Records
Mortgage History
| Date | Status | Borrower | Loan Amount |
|---|---|---|---|
| Open | Worth Timothy B | $95,000 |
Source: Public Records
Tax History Compared to Growth
Tax History
| Year | Tax Paid | Tax Assessment Tax Assessment Total Assessment is a certain percentage of the fair market value that is determined by local assessors to be the total taxable value of land and additions on the property. | Land | Improvement |
|---|---|---|---|---|
| 2024 | $2,215 | $32,090 | $4,210 | $27,880 |
| 2023 | $2,215 | $32,090 | $4,210 | $27,880 |
| 2022 | $1,970 | $28,090 | $3,960 | $24,130 |
| 2021 | $1,979 | $28,900 | $4,080 | $24,820 |
| 2020 | $1,680 | $25,130 | $4,290 | $20,840 |
| 2019 | $1,589 | $25,130 | $4,290 | $20,840 |
| 2018 | $1,579 | $22,760 | $3,960 | $18,800 |
| 2017 | $1,355 | $22,760 | $3,960 | $18,800 |
| 2016 | $1,355 | $22,010 | $4,380 | $17,630 |
| 2015 | $1,375 | $22,010 | $4,380 | $17,630 |
| 2014 | $1,093 | $17,610 | $3,980 | $13,630 |
Source: Public Records
Map
Nearby Homes
- 386 Ridge Circle Dr
- 395 Sand Cliff Ct Unit A
- 405 Sand Cliff Ct Unit A
- 373 Ridges Blvd Unit 113
- 391 E Valley Cir Unit 1
- 379 Explorer Ct Unit A
- 364 Cliff View Dr
- 392 W Ridges Blvd Unit C
- 392 W Ridges Blvd Unit B
- 392 W Ridges Blvd Unit D
- TBD School Ridge Rd
- TBD School Ridge Rd Unit Two Parcels
- 2398 Ridge Circle Dr Unit C
- 2398 Ridge Circle Dr Unit B
- 2398 Ridge Circle Dr Unit A
- 377 High Desert Rd
- 373 Aiguille Dr
- 368 Hidden Ct
- 363 Hidden Ct
- 371 Aiguille Dr
- Lot 2 Ridge Circle Dr
- 380 Ridge Circle Dr
- 382 Cliff Rosa Ct
- 386 1/2 Ridge Circle Dr Unit C
- 378 1/2 Soapweed Ct
- 381 Ridge Circle Dr
- 384 1/2 Cliff Rosa Ct
- 384 Cliff Rosa Ct
- 383 Ridge Circle Dr
- 374 Soapweed Ct
- 386 Ridge View Dr
- 385 Ridge Circle Dr
- 382 1/2 Cliff Rosa Ct
- 382 1/2 Ridge View Dr
- 386 1/2 Ridge View Dr
- 384 Ridge View Dr
- 388 Ridge View Dr
- 374 1/2 Soapweed Ct
- 382 Ridge View Dr
- 378 Soapweed Ct