380 Durham Dr Hoschton, GA 30548
Estimated Value: $505,000 - $761,000
4
Beds
2
Baths
2,925
Sq Ft
$209/Sq Ft
Est. Value
About This Home
This home is located at 380 Durham Dr, Hoschton, GA 30548 and is currently estimated at $612,645, approximately $209 per square foot. 380 Durham Dr is a home located in Jackson County with nearby schools including West Jackson Elementary School, West Jackson Middle School, and Jackson County High School.
Ownership History
Date
Name
Owned For
Owner Type
Purchase Details
Closed on
Dec 30, 2015
Sold by
Mccausland Timothy W
Bought by
Settles Robert L and Settles Jane E
Current Estimated Value
Purchase Details
Closed on
Oct 6, 2011
Sold by
Collett Robert A
Bought by
Marquess Kathryn E
Home Financials for this Owner
Home Financials are based on the most recent Mortgage that was taken out on this home.
Original Mortgage
$172,710
Interest Rate
3.25%
Mortgage Type
FHA
Purchase Details
Closed on
Sep 5, 2006
Sold by
Not Provided
Bought by
Collett Robert A and Pittman Tiffany N
Home Financials for this Owner
Home Financials are based on the most recent Mortgage that was taken out on this home.
Original Mortgage
$265,900
Interest Rate
6.52%
Mortgage Type
New Conventional
Purchase Details
Closed on
Feb 21, 2006
Sold by
Not Provided
Bought by
Collett Robert A and Pittman Tiffany N
Create a Home Valuation Report for This Property
The Home Valuation Report is an in-depth analysis detailing your home's value as well as a comparison with similar homes in the area
Home Values in the Area
Average Home Value in this Area
Purchase History
| Date | Buyer | Sale Price | Title Company |
|---|---|---|---|
| Settles Robert L | $294,500 | -- | |
| Marquess Kathryn E | $180,000 | -- | |
| Collett Robert A | $279,900 | -- | |
| Collett Robert A | $50,000 | -- |
Source: Public Records
Mortgage History
| Date | Status | Borrower | Loan Amount |
|---|---|---|---|
| Previous Owner | Marquess Kathryn E | $172,710 | |
| Previous Owner | Collett Robert A | $265,900 |
Source: Public Records
Tax History Compared to Growth
Tax History
| Year | Tax Paid | Tax Assessment Tax Assessment Total Assessment is a certain percentage of the fair market value that is determined by local assessors to be the total taxable value of land and additions on the property. | Land | Improvement |
|---|---|---|---|---|
| 2024 | $5,358 | $205,440 | $30,320 | $175,120 |
| 2023 | $5,358 | $186,640 | $30,320 | $156,320 |
| 2022 | $4,498 | $156,520 | $30,320 | $126,200 |
| 2021 | $4,609 | $156,520 | $30,320 | $126,200 |
| 2020 | $3,960 | $125,440 | $21,960 | $103,480 |
| 2019 | $4,020 | $125,440 | $21,960 | $103,480 |
| 2018 | $3,904 | $120,400 | $21,960 | $98,440 |
| 2017 | $3,626 | $111,072 | $21,960 | $89,112 |
| 2016 | $3,708 | $111,072 | $21,960 | $89,112 |
| 2015 | $3,397 | $101,912 | $12,800 | $89,112 |
| 2014 | $2,647 | $79,296 | $12,800 | $66,496 |
| 2013 | -- | $79,296 | $12,800 | $66,496 |
Source: Public Records
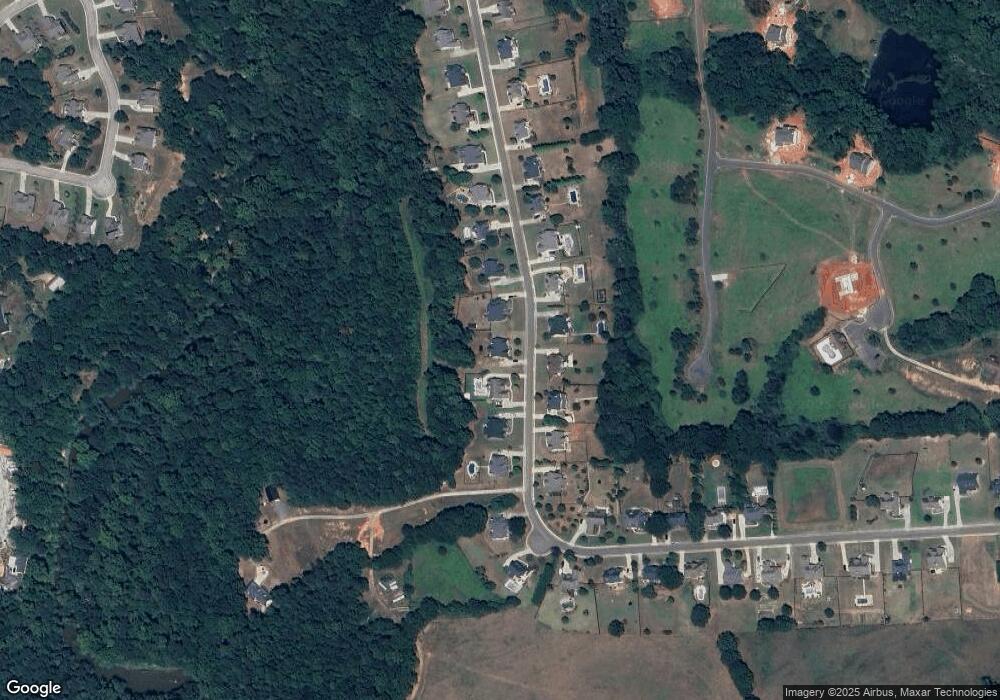
Map
Nearby Homes
- 13 Blue Rider Trail
- 13 Blue Rider Trail Unit 37
- The Mulberry Plan at Steeplechase
- The Milton Plan at Steeplechase
- The Brookdale Plan at Steeplechase
- Kingston Plan at Steeplechase
- 204 Races Rd
- 152 Blue Rider Trail
- 180 Races Rd
- 184 Celestial Run
- 0 Moon Bridge Rd Unit 10632936
- 1238 Tapp Wood Rd
- 0 Mulberry Trail Unit 7684364
- 722 Moonlite Trace
- 153 Cherokee Trail
- 131 Canix Ln
- 809 Moon Bridge Rd
- 752 Moon Bridge Rd
- 404 Shasta Ct
- 0 Mulberry Cir Unit 10647438