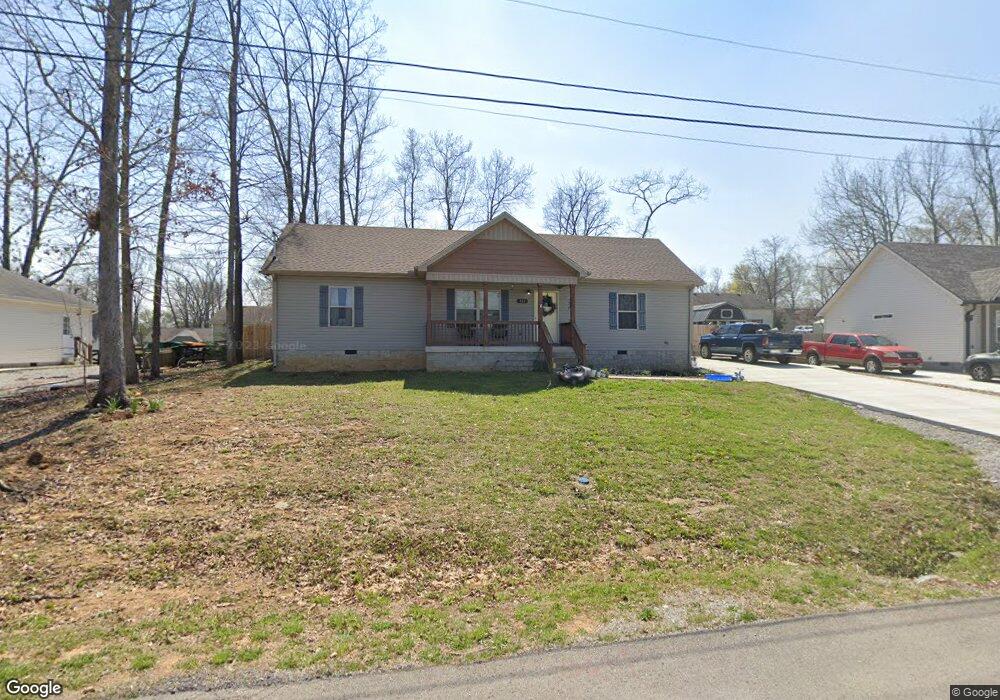
380 Elm Ave Lewisburg, TN 37091
Estimated Value: $260,036 - $281,000
--
Bed
1
Bath
1,296
Sq Ft
$210/Sq Ft
Est. Value
About This Home
This home is located at 380 Elm Ave, Lewisburg, TN 37091 and is currently estimated at $272,259, approximately $210 per square foot. 380 Elm Ave is a home with nearby schools including Marshall Elementary School, Oak Grove Elementary School, and Westhills Elementary School.
Ownership History
Date
Name
Owned For
Owner Type
Purchase Details
Closed on
Mar 4, 2022
Sold by
Turner Dustin L
Bought by
Turner Cortney
Current Estimated Value
Home Financials for this Owner
Home Financials are based on the most recent Mortgage that was taken out on this home.
Original Mortgage
$182,400
Outstanding Balance
$170,420
Interest Rate
3.92%
Mortgage Type
New Conventional
Estimated Equity
$101,839
Purchase Details
Closed on
Aug 31, 2018
Sold by
Knox Jeff
Bought by
Turner Dustin L
Home Financials for this Owner
Home Financials are based on the most recent Mortgage that was taken out on this home.
Original Mortgage
$139,035
Interest Rate
4.62%
Mortgage Type
FHA
Purchase Details
Closed on
Nov 30, 2017
Sold by
Rome Steve
Bought by
Knox Jeff
Purchase Details
Closed on
Nov 19, 2009
Bought by
Rome Steve and Rome Dianne
Purchase Details
Closed on
Sep 10, 2007
Bought by
Knox Jeff
Create a Home Valuation Report for This Property
The Home Valuation Report is an in-depth analysis detailing your home's value as well as a comparison with similar homes in the area
Home Values in the Area
Average Home Value in this Area
Purchase History
| Date | Buyer | Sale Price | Title Company |
|---|---|---|---|
| Turner Cortney | -- | Marshall County Title | |
| Turner Dustin L | $141,600 | -- | |
| Knox Jeff | -- | -- | |
| Rome Steve | $101,700 | -- | |
| Knox Jeff | $185,000 | -- |
Source: Public Records
Mortgage History
| Date | Status | Borrower | Loan Amount |
|---|---|---|---|
| Open | Turner Cortney | $182,400 | |
| Previous Owner | Turner Dustin L | $139,035 |
Source: Public Records
Tax History Compared to Growth
Tax History
| Year | Tax Paid | Tax Assessment Tax Assessment Total Assessment is a certain percentage of the fair market value that is determined by local assessors to be the total taxable value of land and additions on the property. | Land | Improvement |
|---|---|---|---|---|
| 2024 | -- | $50,300 | $4,750 | $45,550 |
| 2023 | $1,561 | $50,300 | $4,750 | $45,550 |
| 2022 | $1,561 | $50,300 | $4,750 | $45,550 |
| 2021 | $1,347 | $28,950 | $2,500 | $26,450 |
| 2020 | $1,347 | $28,950 | $2,500 | $26,450 |
| 2019 | $1,303 | $28,950 | $2,500 | $26,450 |
| 2018 | $111 | $28,425 | $2,500 | $25,925 |
| 2017 | $111 | $2,500 | $2,500 | $0 |
| 2016 | $115 | $2,250 | $2,250 | $0 |
| 2015 | $105 | $2,250 | $2,250 | $0 |
| 2014 | $105 | $2,250 | $2,250 | $0 |
Source: Public Records
Map
Nearby Homes
- 391 Elm Ave
- 411 Elm Ave
- 131 Isabela Dr
- 141 Isabela Dr
- 330 Hickory Cir
- 125 Armory Dr
- 126 Armory Dr
- 3019 Cambridge Ct
- 3021 Cambridge Ct
- 1183 Finley Beech Rd
- 188 Trey Dr
- 155 Landon Ln
- 301 East Ave
- 380 Baxter Ave
- 755 Center St
- 224 Hardison Ave
- 198 Creekside Dr
- 200 Creekside Dr
- 197 Creekside Dr
- 199 Creekside Dr