Estimated Value: $316,000 - $363,000
2
Beds
1
Bath
1,152
Sq Ft
$297/Sq Ft
Est. Value
About This Home
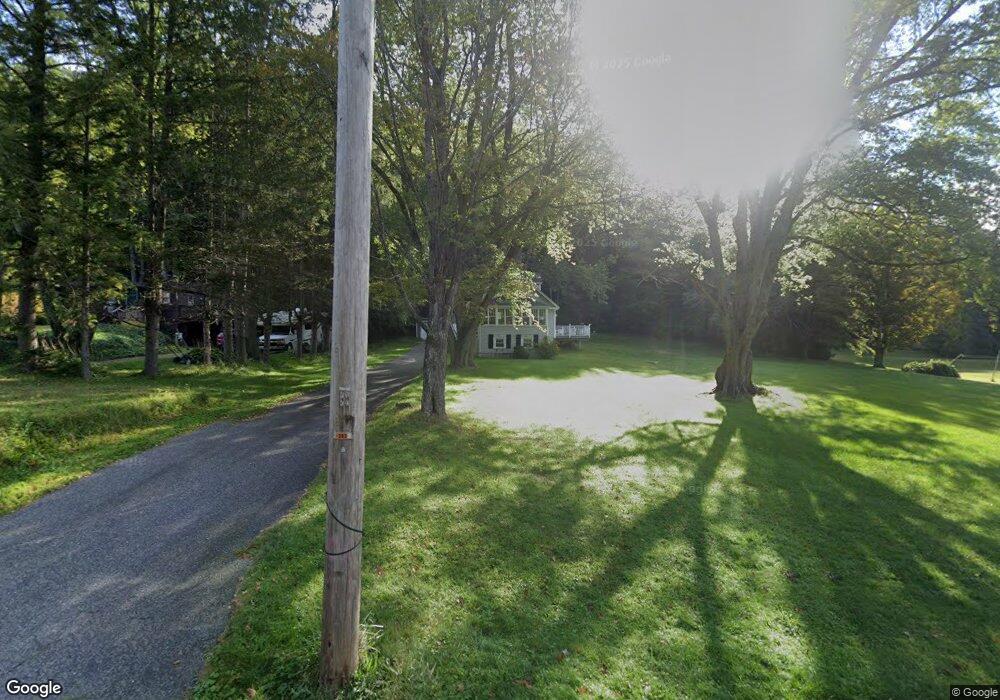
This home is located at 380 Greylock St, Lee, MA 01238 and is currently estimated at $342,279, approximately $297 per square foot. 380 Greylock St is a home located in Berkshire County with nearby schools including Lee Elementary School, Lee Middle/High School, and St. Mary's School.
Ownership History
Date
Name
Owned For
Owner Type
Purchase Details
Closed on
Jun 23, 1998
Sold by
Toole Joseph M and Toole Lynn M
Bought by
Eckert Edward R and Eckert Nancy E
Current Estimated Value
Home Financials for this Owner
Home Financials are based on the most recent Mortgage that was taken out on this home.
Original Mortgage
$180,000
Outstanding Balance
$36,135
Interest Rate
7.09%
Mortgage Type
Purchase Money Mortgage
Estimated Equity
$306,144
Create a Home Valuation Report for This Property
The Home Valuation Report is an in-depth analysis detailing your home's value as well as a comparison with similar homes in the area
Home Values in the Area
Average Home Value in this Area
Purchase History
| Date | Buyer | Sale Price | Title Company |
|---|---|---|---|
| Eckert Edward R | $60,000 | -- |
Source: Public Records
Mortgage History
| Date | Status | Borrower | Loan Amount |
|---|---|---|---|
| Open | Eckert Edward R | $30,000 | |
| Open | Eckert Edward R | $180,000 | |
| Previous Owner | Eckert Edward R | $20,000 |
Source: Public Records
Tax History Compared to Growth
Tax History
| Year | Tax Paid | Tax Assessment Tax Assessment Total Assessment is a certain percentage of the fair market value that is determined by local assessors to be the total taxable value of land and additions on the property. | Land | Improvement |
|---|---|---|---|---|
| 2025 | $3,323 | $295,400 | $113,700 | $181,700 |
| 2024 | $3,144 | $279,700 | $108,200 | $171,500 |
| 2023 | $2,984 | $252,200 | $104,000 | $148,200 |
| 2022 | $2,962 | $217,000 | $98,200 | $118,800 |
| 2021 | $2,753 | $187,500 | $88,100 | $99,400 |
| 2020 | $2,653 | $180,700 | $82,400 | $98,300 |
| 2019 | $2,727 | $184,500 | $84,400 | $100,100 |
| 2018 | $2,699 | $184,500 | $84,400 | $100,100 |
| 2017 | $2,650 | $180,000 | $72,100 | $107,900 |
| 2016 | $2,590 | $177,900 | $70,000 | $107,900 |
| 2015 | $2,423 | $172,100 | $70,000 | $102,100 |
| 2014 | $2,333 | $164,900 | $70,000 | $94,900 |
Source: Public Records
Map
Nearby Homes
- 100 Franklin St
- 160 High St
- 135 East St
- lot 1 N Beckett
- 0 East St Unit 235893
- 90 Maple St
- 180 Center St
- 205 High St
- 175 Center St Unit 3
- 208 Main St
- 5, 15, 17 Fuller St
- 6 Margerie St
- 355 Laurel St
- 880 East St Unit 16D
- 45 Forest St
- 705 Cape St Unit 2
- 120 Parkview Terrace
- 40 Stringer Ave
- 90 Via Franco
- 615 Laurel St
- 390 Greylock St
- 360 Greylock St
- 410 Greylock St
- 387 Greylock St
- 375 Greylock St
- 407 Greylock St
- 350 Greylock St
- 401 Greylock St
- 365 Greylock St
- 420 Greylock St
- 422 Greylock St
- 421 Greylock St
- 345 Greylock St
- 335 Greylock St
- 435 Greylock St
- 440 Greylock St
- 431 Greylock St
- 450 Greylock St
- 175 Orchard St
- 455 Greylock St