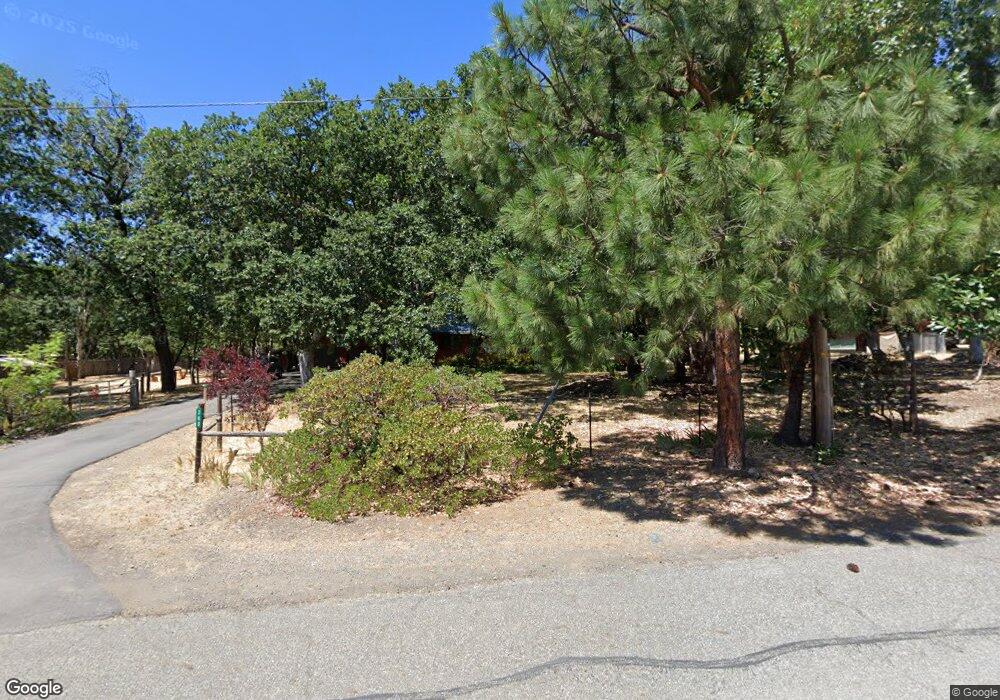
380 Hardy Ln Hayfork, CA 96041
Estimated Value: $266,000 - $367,003
Studio
--
Bath
--
Sq Ft
2.04
Acres Lot
About This Home
This home is located at 380 Hardy Ln, Hayfork, CA 96041 and is currently estimated at $309,001. 380 Hardy Ln is a home with nearby schools including Hayfork High School.
Ownership History
Date
Name
Owned For
Owner Type
Purchase Details
Closed on
Aug 20, 2014
Sold by
Anderson John and Anderson Kathleen
Bought by
The John & Kathleen Anderson Living Trus
Current Estimated Value
Purchase Details
Closed on
Nov 19, 2004
Sold by
Coon Grant V
Bought by
Anderson John and Anderson Kathleen
Home Financials for this Owner
Home Financials are based on the most recent Mortgage that was taken out on this home.
Original Mortgage
$188,000
Outstanding Balance
$93,443
Interest Rate
5.72%
Mortgage Type
Purchase Money Mortgage
Estimated Equity
$215,558
Create a Home Valuation Report for This Property
The Home Valuation Report is an in-depth analysis detailing your home's value as well as a comparison with similar homes in the area
Home Values in the Area
Average Home Value in this Area
Purchase History
We collect this data history from publicly available records. To have your information removed, we recommend requesting removal directly through your county’s website.
| Date | Buyer | Sale Price | Title Company |
|---|---|---|---|
| The John & Kathleen Anderson Living Trus | -- | None Available | |
| Anderson John | $235,000 | Trinity Co Title Co |
Source: Public Records
Mortgage History
We collect this data history from publicly available records. To have your information removed, we recommend requesting removal directly through your county’s website.
| Date | Status | Borrower | Loan Amount |
|---|---|---|---|
| Open | Anderson John | $188,000 |
Source: Public Records
Tax History
| Year | Tax Paid | Tax Assessment Tax Assessment Total Assessment is a certain percentage of the fair market value that is determined by local assessors to be the total taxable value of land and additions on the property. | Land | Improvement |
|---|---|---|---|---|
| 2025 | $3,946 | $368,234 | $47,910 | $320,324 |
| 2024 | $3,923 | $361,509 | $46,971 | $314,538 |
| 2023 | $3,923 | $353,965 | $46,050 | $307,915 |
| 2022 | $3,842 | $347,081 | $45,148 | $301,933 |
| 2021 | $3,542 | $340,442 | $44,263 | $296,179 |
| 2020 | $3,491 | $337,232 | $43,810 | $293,422 |
| 2019 | $3,426 | $330,899 | $42,951 | $287,948 |
| 2018 | $3,318 | $324,740 | $42,109 | $282,631 |
| 2017 | $3,345 | $322,078 | $41,284 | $280,794 |
| 2016 | $3,341 | $328,301 | $46,284 | $282,017 |
| 2015 | $3,311 | $325,514 | $45,589 | $279,925 |
| 2014 | $3,209 | $313,641 | $39,794 | $273,847 |
Source: Public Records
Map
Nearby Homes
Your Personal Tour Guide
Ask me questions while you tour the home.