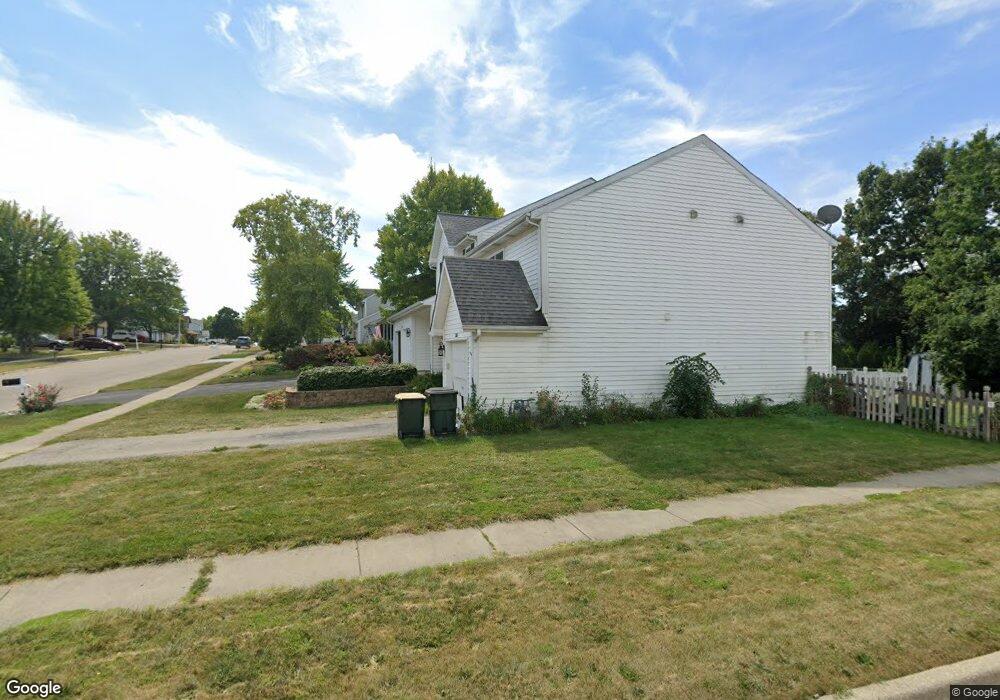
380 Joren Trail Antioch, IL 60002
North Park NeighborhoodEstimated Value: $216,000 - $246,000
3
Beds
2
Baths
1,331
Sq Ft
$174/Sq Ft
Est. Value
About This Home
This home is located at 380 Joren Trail, Antioch, IL 60002 and is currently estimated at $231,867, approximately $174 per square foot. 380 Joren Trail is a home located in Lake County with nearby schools including Antioch Community High School.
Ownership History
Date
Name
Owned For
Owner Type
Purchase Details
Closed on
Apr 27, 2018
Sold by
Burzawa Brandon
Bought by
Burzawa Brandon and Rodriguez Laura
Current Estimated Value
Home Financials for this Owner
Home Financials are based on the most recent Mortgage that was taken out on this home.
Original Mortgage
$135,327
Outstanding Balance
$117,754
Interest Rate
4.87%
Mortgage Type
FHA
Estimated Equity
$114,113
Purchase Details
Closed on
May 3, 2007
Sold by
Knue Jacqueline F
Bought by
Ultsch Thomas
Purchase Details
Closed on
Jun 28, 2001
Sold by
Knue Jacqueline F and Knue John F
Bought by
Knue Jacqueline F
Home Financials for this Owner
Home Financials are based on the most recent Mortgage that was taken out on this home.
Original Mortgage
$90,000
Interest Rate
7.16%
Purchase Details
Closed on
Dec 10, 1996
Sold by
Morrill William D and Morrill Katherine L
Bought by
Knue Jacqueline F and Knue John F
Home Financials for this Owner
Home Financials are based on the most recent Mortgage that was taken out on this home.
Original Mortgage
$83,232
Interest Rate
7.85%
Mortgage Type
FHA
Create a Home Valuation Report for This Property
The Home Valuation Report is an in-depth analysis detailing your home's value as well as a comparison with similar homes in the area
Home Values in the Area
Average Home Value in this Area
Purchase History
| Date | Buyer | Sale Price | Title Company |
|---|---|---|---|
| Burzawa Brandon | -- | None Available | |
| Burzawa Brandon | $140,000 | Chicago Title | |
| Ultsch Thomas | $156,000 | Fort Dearborn Land Title | |
| Knue Jacqueline F | -- | Freedom Title | |
| Knue Jacqueline F | $102,000 | -- |
Source: Public Records
Mortgage History
| Date | Status | Borrower | Loan Amount |
|---|---|---|---|
| Open | Burzawa Brandon | $135,327 | |
| Previous Owner | Knue Jacqueline F | $90,000 | |
| Previous Owner | Knue Jacqueline F | $83,232 |
Source: Public Records
Tax History Compared to Growth
Tax History
| Year | Tax Paid | Tax Assessment Tax Assessment Total Assessment is a certain percentage of the fair market value that is determined by local assessors to be the total taxable value of land and additions on the property. | Land | Improvement |
|---|---|---|---|---|
| 2024 | $5,591 | $56,726 | $3,919 | $52,807 |
| 2023 | $4,684 | $50,793 | $3,509 | $47,284 |
| 2022 | $4,684 | $41,700 | $4,226 | $37,474 |
| 2021 | $4,364 | $38,910 | $3,943 | $34,967 |
| 2020 | $4,284 | $37,835 | $3,834 | $34,001 |
| 2019 | $4,355 | $36,181 | $3,666 | $32,515 |
| 2018 | $4,168 | $35,183 | $3,723 | $31,460 |
| 2017 | $4,137 | $33,489 | $3,544 | $29,945 |
| 2016 | $4,047 | $32,319 | $3,420 | $28,899 |
| 2015 | $3,961 | $33,139 | $3,333 | $29,806 |
| 2014 | $3,463 | $35,830 | $7,201 | $28,629 |
| 2012 | $3,209 | $35,830 | $7,201 | $28,629 |
Source: Public Records
Map
Nearby Homes
- 570 Collier Dr
- 425 Joren Trail
- 336 Hawthorn Ln
- 603 Ridgewood Dr
- 558 1st St
- 582 Phillips Cir
- 394 Birchwood Dr
- 23607 125th St
- 12719 234th Ave
- 602 Anita Ave
- 811 Tiffany Farms Rd
- 735 Creek Bend Ln
- 801 Main St
- 188 Oakwood Dr
- 12290 233rd Ave
- 198 Bridgewood Dr
- 12621 257th Ave
- 324 Elmwood Ln
- 770 Anita Ave
- Lt35 128th St
- 380 Joren Trail
- 382 Joren Trail
- 392 Joren Trail
- 560 Collier Dr
- 400 Joren Trail
- 369 Pondview Dr
- 566 Collier Dr
- 362 Joren Trail
- 371 Joren Trail
- 369 Joren Trail
- 373 Joren Trail
- 402 Joren Trail
- 367 Joren Trail
- 391 Joren Trail
- 363 Joren Trail
- 404 Joren Trail
- 404 Joren Trail Unit 404
- 361 Pondview Dr
- 360 Joren Trail
- 361 Joren Trail