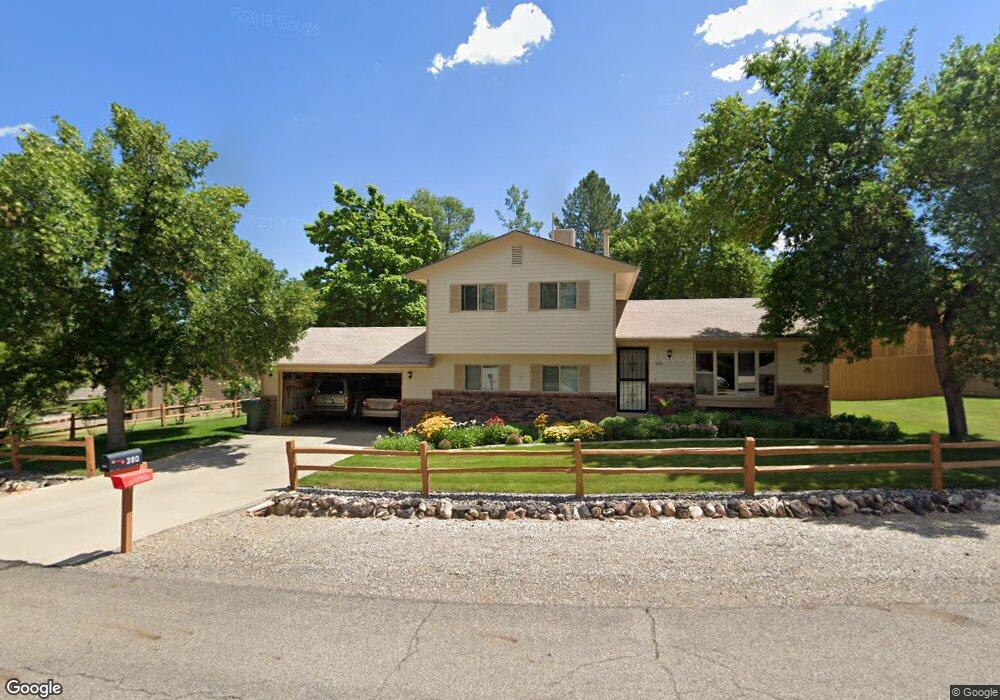
380 W Valley Cir Grand Junction, CO 81507
Redlands NeighborhoodEstimated Value: $426,000 - $545,000
3
Beds
4
Baths
1,560
Sq Ft
$295/Sq Ft
Est. Value
About This Home
This home is located at 380 W Valley Cir, Grand Junction, CO 81507 and is currently estimated at $460,090, approximately $294 per square foot. 380 W Valley Cir is a home located in Mesa County with nearby schools including Scenic Elementary School, Redlands Middle School, and Grand Junction High School.
Ownership History
Date
Name
Owned For
Owner Type
Purchase Details
Closed on
Oct 5, 2017
Sold by
Smith Lonnie L and Morris Brenda A
Bought by
Smith Lonnie L and Smith Brenda A
Current Estimated Value
Home Financials for this Owner
Home Financials are based on the most recent Mortgage that was taken out on this home.
Original Mortgage
$20,000
Outstanding Balance
$13,857
Interest Rate
3.86%
Mortgage Type
Commercial
Estimated Equity
$446,233
Purchase Details
Closed on
Feb 4, 2005
Sold by
Smith Lonnie L
Bought by
Smith Lonnie L and Morris Brenda A
Purchase Details
Closed on
Jul 20, 1995
Sold by
Smith Lonnie L
Bought by
Smith Lonnie L
Purchase Details
Closed on
Jul 28, 1992
Sold by
Ridges Metropolitan District
Bought by
Smith Lonnie L
Purchase Details
Closed on
Jul 14, 1992
Sold by
Ridges Metropolitan District
Bought by
Smith Lonnie L
Purchase Details
Closed on
Nov 9, 1990
Sold by
Gault George H
Bought by
Smith Lonnie L
Purchase Details
Closed on
Jul 27, 1989
Sold by
Gervais Robert B
Bought by
Smith Lonnie L
Create a Home Valuation Report for This Property
The Home Valuation Report is an in-depth analysis detailing your home's value as well as a comparison with similar homes in the area
Home Values in the Area
Average Home Value in this Area
Purchase History
| Date | Buyer | Sale Price | Title Company |
|---|---|---|---|
| Smith Lonnie L | -- | None Available | |
| Smith Lonnie L | -- | -- | |
| Smith Lonnie L | -- | -- | |
| Smith Lonnie L | -- | -- | |
| Smith Lonnie L | -- | -- | |
| Smith Lonnie L | $75,000 | -- | |
| Smith Lonnie L | $73,500 | -- |
Source: Public Records
Mortgage History
| Date | Status | Borrower | Loan Amount |
|---|---|---|---|
| Open | Smith Lonnie L | $20,000 |
Source: Public Records
Tax History Compared to Growth
Tax History
| Year | Tax Paid | Tax Assessment Tax Assessment Total Assessment is a certain percentage of the fair market value that is determined by local assessors to be the total taxable value of land and additions on the property. | Land | Improvement |
|---|---|---|---|---|
| 2024 | $1,015 | $21,410 | $4,000 | $17,410 |
| 2023 | $1,015 | $21,410 | $4,000 | $17,410 |
| 2022 | $896 | $19,730 | $3,960 | $15,770 |
| 2021 | $901 | $20,300 | $4,080 | $16,220 |
| 2020 | $679 | $17,310 | $4,290 | $13,020 |
| 2019 | $642 | $17,310 | $4,290 | $13,020 |
| 2018 | $584 | $15,620 | $3,960 | $11,660 |
| 2017 | $583 | $15,620 | $3,960 | $11,660 |
| 2016 | $953 | $15,480 | $4,380 | $11,100 |
| 2015 | $967 | $15,480 | $4,380 | $11,100 |
| 2014 | $796 | $12,820 | $3,980 | $8,840 |
Source: Public Records
Map
Nearby Homes
- 379 Explorer Ct Unit A
- 391 E Valley Cir Unit 1
- 373 Ridges Blvd Unit 113
- 386 Ridge Circle Dr
- 364 Cliff View Dr
- 368 Hidden Ct
- 363 Hidden Ct
- 379 Elysium Dr
- 380 Elysium Dr
- 2404 Spire Ct
- 381 Elysium Dr
- 367 Hidden Ct
- 373 Aiguille Dr
- 377 Elysium Dr
- 2398 Ridge Circle Dr Unit C
- 2398 Ridge Circle Dr Unit B
- 2398 Ridge Circle Dr Unit A
- 382 Elysium Dr
- 371 Aiguille Dr
- 369 Hidden Ct
- 380 1/4 W Valley Cir
- 379 E Valley Cir
- 381 E Valley Cir Unit 2
- 381 E Valley Cir
- 376 E Valley Cir
- 381 W Valley Cir
- 375 W Valley Cir Unit B
- 375 W Valley Cir Unit A
- 381 1/2 W Valley Cir
- 376 1/2 E Valley Cir
- 383 W Valley Cir
- 382 W Valley Cir
- 383 E Valley Cir Unit 1
- 383 E Valley Cir Unit 2
- 383 1/2 W Valley Cir
- 378 1/2 E Valley Cir
- 378 E Valley Cir Unit C
- 379 W Valley Cir Unit A
- 379 W Valley Cir Unit B
- 382 E Valley Cir Unit W