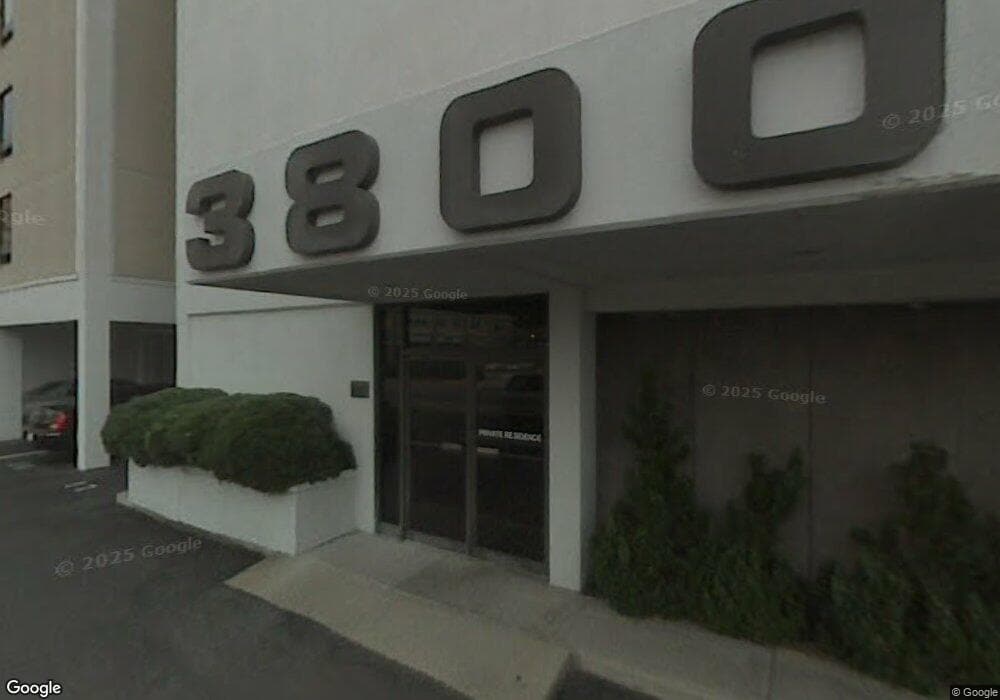
3800 Atlantic Ave Unit 1103 Virginia Beach, VA 23451
Oceanfront NeighborhoodEstimated Value: $746,000 - $834,781
2
Beds
2
Baths
1,314
Sq Ft
$599/Sq Ft
Est. Value
About This Home
This home is located at 3800 Atlantic Ave Unit 1103, Virginia Beach, VA 23451 and is currently estimated at $787,195, approximately $599 per square foot. 3800 Atlantic Ave Unit 1103 is a home located in Virginia Beach City with nearby schools including Linkhorn Park Elementary School, Virginia Beach Middle School, and Frank W. Cox High School.
Ownership History
Date
Name
Owned For
Owner Type
Purchase Details
Closed on
Jul 14, 2023
Sold by
Weikert Scott A and Weikert Janet M
Bought by
Cobbs Lashanda and Cobbs Charles
Current Estimated Value
Purchase Details
Closed on
Jun 19, 2015
Sold by
Vourakis Trustee Zan
Bought by
Weikert Scott A
Home Financials for this Owner
Home Financials are based on the most recent Mortgage that was taken out on this home.
Original Mortgage
$319,200
Interest Rate
3.88%
Mortgage Type
New Conventional
Purchase Details
Closed on
Sep 5, 2001
Sold by
Lawson Harry G
Bought by
Vourakis Zan
Home Financials for this Owner
Home Financials are based on the most recent Mortgage that was taken out on this home.
Original Mortgage
$160,000
Interest Rate
6.99%
Create a Home Valuation Report for This Property
The Home Valuation Report is an in-depth analysis detailing your home's value as well as a comparison with similar homes in the area
Home Values in the Area
Average Home Value in this Area
Purchase History
| Date | Buyer | Sale Price | Title Company |
|---|---|---|---|
| Cobbs Lashanda | $795,000 | Sage Title | |
| Weikert Scott A | $399,000 | -- | |
| Vourakis Zan | $290,000 | -- |
Source: Public Records
Mortgage History
| Date | Status | Borrower | Loan Amount |
|---|---|---|---|
| Previous Owner | Weikert Scott A | $319,200 | |
| Previous Owner | Vourakis Zan | $160,000 |
Source: Public Records
Tax History Compared to Growth
Tax History
| Year | Tax Paid | Tax Assessment Tax Assessment Total Assessment is a certain percentage of the fair market value that is determined by local assessors to be the total taxable value of land and additions on the property. | Land | Improvement |
|---|---|---|---|---|
| 2025 | $6,225 | $667,400 | $101,800 | $565,600 |
| 2024 | $6,225 | $641,800 | $97,900 | $543,900 |
| 2023 | $5,251 | $530,400 | $80,900 | $449,500 |
| 2022 | $4,780 | $482,800 | $73,700 | $409,100 |
| 2021 | $4,193 | $423,500 | $64,600 | $358,900 |
| 2020 | $4,107 | $403,600 | $61,600 | $342,000 |
| 2019 | $3,674 | $328,800 | $50,200 | $278,600 |
| 2018 | $3,296 | $328,800 | $50,200 | $278,600 |
| 2017 | $3,296 | $328,800 | $50,200 | $278,600 |
| 2016 | $4,069 | $411,000 | $62,700 | $348,300 |
| 2015 | $4,788 | $483,600 | $73,800 | $409,800 |
| 2014 | $4,125 | $483,600 | $73,800 | $409,800 |
Source: Public Records
Map
Nearby Homes
- 3810 Atlantic Ave Unit 404
- 4004 Atlantic Ave Unit 404
- 4004 Atlantic Ave Unit 1710
- 4004 Atlantic Ave Unit PH3
- 4004 Atlantic Ave Unit 707
- 4004 Atlantic Ave Unit 1004
- 4004 Atlantic Ave Unit 1911
- 4004 Atlantic Ave Unit 309
- 4004 Atlantic Ave Unit CS9
- 4004 Atlantic Ave Unit 304
- 3615 Atlantic Ave Unit 301
- 209 Glenn Miller St
- 4044 Harlow St
- 3941 Ocean Cut Ln
- 4129 Fitzgerald Way
- The Alexander Plan at Sea Pines
- The Linkhorn Plan at Sea Pines
- 405 33rd Half St Unit B
- 506 Cavalier Dr
- 300 Bay Colony Dr
- 3800 Atlantic Ave Unit 703
- 3800 Atlantic Ave Unit 902
- 3800 Atlantic Ave Unit 702
- 3800 Atlantic Ave Unit 1002
- 3800 Atlantic Ave Unit 404
- 3800 Atlantic Ave Unit 402
- 3800 Atlantic Ave Unit 1003
- 3800 Atlantic Ave Unit 504
- 3800 Atlantic Ave Unit 1104
- 3800 Atlantic Ave Unit 303
- 3800 Atlantic Ave Unit 403
- 3800 Atlantic Ave Unit 603
- 3800 Atlantic Ave Unit 1102
- 3800 Atlantic Ave Unit 904
- 3800 Atlantic Ave Unit 1101
- 3800 Atlantic Ave Unit 1004
- 3800 Atlantic Ave Unit 1204
- 3800 Atlantic Ave Unit 1202
- 3800 Atlantic Ave Unit 1201
- 3800 Atlantic Ave Unit 1001