A
Landlord's Agent in 2022
Alec Vianello
eXp Realty


Estimated Value: $324,000 - $424,000
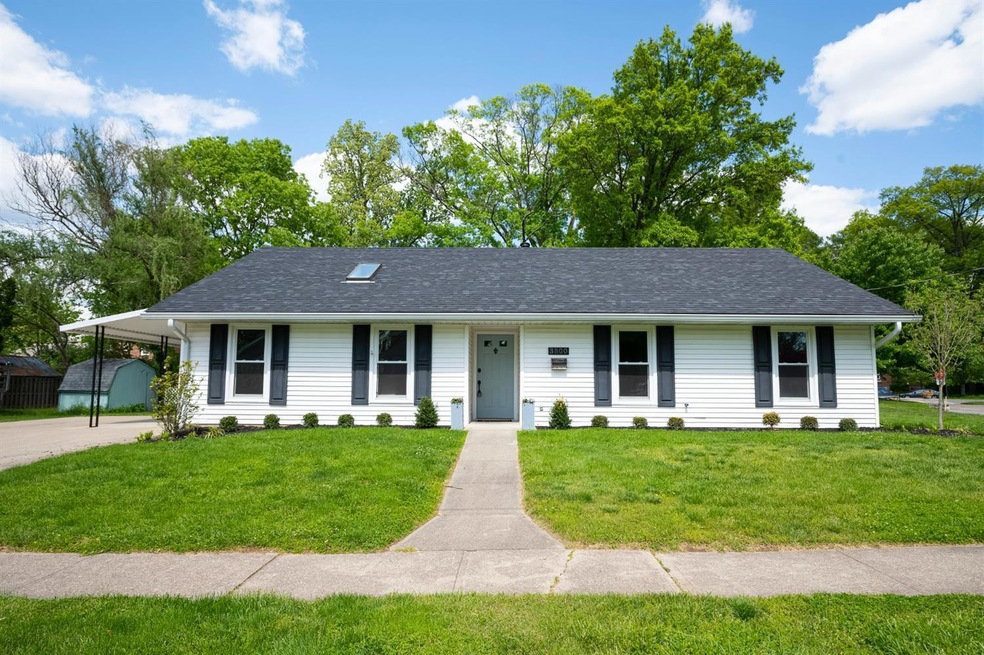
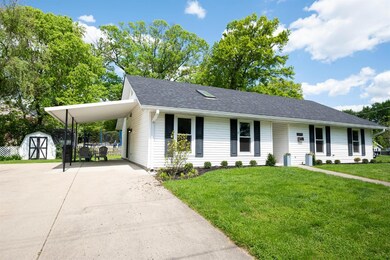
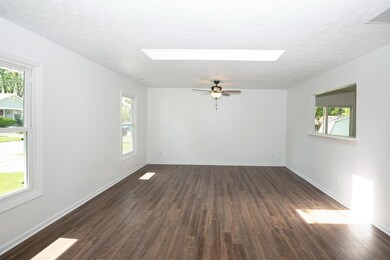
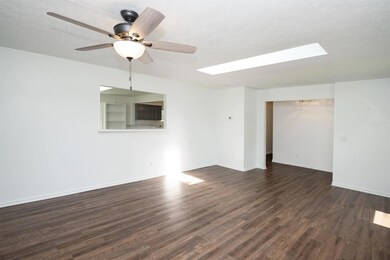
Rent this beautiful home located in Mariemont City Schools. Spacious ranch with over 1750 sq.ft on a very large lot. Recently updated. 3 bedrooms and 2 full baths. Pets are negotiable. Occupancy starting October 10th.
Last Agent to Rent the Property
Alec Vianello
eXp Realty License #2020006178 Listed on: 09/05/2022

Last Renter's Agent
Alec Vianello
eXp Realty License #2020006178 Listed on: 09/05/2022
| Date | Event | Price | List to Sale | Price per Sq Ft | Prior Sale |
|---|---|---|---|---|---|
| 12/19/2022 12/19/22 | Off Market | $2,000 | -- | -- | |
| 09/12/2022 09/12/22 | Rented | $2,000 | 0.0% | -- | |
| 09/12/2022 09/12/22 | Under Contract | -- | -- | -- | |
| 09/05/2022 09/05/22 | For Rent | $2,000 | 0.0% | -- | |
| 12/25/2021 12/25/21 | Off Market | $2,000 | -- | -- | |
| 09/24/2021 09/24/21 | Rented | -- | -- | -- | |
| 09/24/2021 09/24/21 | Rented | $2,000 | -7.0% | -- | |
| 09/02/2021 09/02/21 | For Rent | $2,150 | 0.0% | -- | |
| 01/29/2021 01/29/21 | Sold | $200,000 | -13.0% | $113 / Sq Ft | View Prior Sale |
| 12/31/2020 12/31/20 | Pending | -- | -- | -- | |
| 12/28/2020 12/28/20 | For Sale | $230,000 | 0.0% | $130 / Sq Ft | |
| 12/02/2020 12/02/20 | Pending | -- | -- | -- | |
| 10/28/2020 10/28/20 | For Sale | $230,000 | -- | $130 / Sq Ft |
| Year | Tax Paid | Tax Assessment Tax Assessment Total Assessment is a certain percentage of the fair market value that is determined by local assessors to be the total taxable value of land and additions on the property. | Land | Improvement |
|---|---|---|---|---|
| 2024 | $5,660 | $73,591 | $19,880 | $53,711 |
| 2023 | $5,180 | $73,591 | $19,880 | $53,711 |
| 2022 | $5,094 | $60,113 | $10,679 | $49,434 |
| 2021 | $4,966 | $60,113 | $10,679 | $49,434 |
| 2020 | $4,907 | $60,113 | $10,679 | $49,434 |
| 2019 | $4,817 | $53,197 | $9,450 | $43,747 |
| 2018 | $4,707 | $53,197 | $9,450 | $43,747 |
| 2017 | $4,112 | $53,197 | $9,450 | $43,747 |
| 2016 | $4,250 | $52,287 | $9,373 | $42,914 |
| 2015 | $4,185 | $52,287 | $9,373 | $42,914 |
| 2014 | $4,192 | $52,287 | $9,373 | $42,914 |
| 2013 | $3,888 | $50,764 | $9,100 | $41,664 |
A
Landlord's Agent in 2022
Alec Vianello
eXp Realty
Seller's Agent in 2021
Diane Serraino
eXp Realty
(513) 253-6760
1 in this area
174 Total Sales
Seller's Agent in 2021
Drew Mahoney
Sibcy Cline
(513) 258-4040
1 in this area
89 Total Sales
Source: MLS of Greater Cincinnati (CincyMLS)
MLS Number: 1752071
APN: 523-0006-0395
Disclaimer: Certain information contained herein is derived from information provided by parties other than Homes.com. All information provided is deemed reliable, but is not guaranteed to be accurate and should be independently verified.
![]() The data relating to real estate for sale on this website comes in part from the Broker Reciprocity programs of the MLS of Greater Cincinnati, Inc.. Those listings held by brokerage firms other than Ten-X are marked with the Broker Reciprocity logo and house icon. The properties displayed may not be all of the properties available through Broker Reciprocity.
The data relating to real estate for sale on this website comes in part from the Broker Reciprocity programs of the MLS of Greater Cincinnati, Inc.. Those listings held by brokerage firms other than Ten-X are marked with the Broker Reciprocity logo and house icon. The properties displayed may not be all of the properties available through Broker Reciprocity.
IDX information is provided exclusively for personal, non-commercial use, and may not be used for any purpose other than to identify prospective properties consumers may be interested in purchasing.
Information is deemed reliable but not guaranteed.
Ten-X does not display the entire Cincinnati MLS Broker Reciprocity™ database on this web site. The listings of some real estate brokerage firms have been excluded.
Copyright 2025, MLS of Greater Cincinnati, Inc. All rights reserved