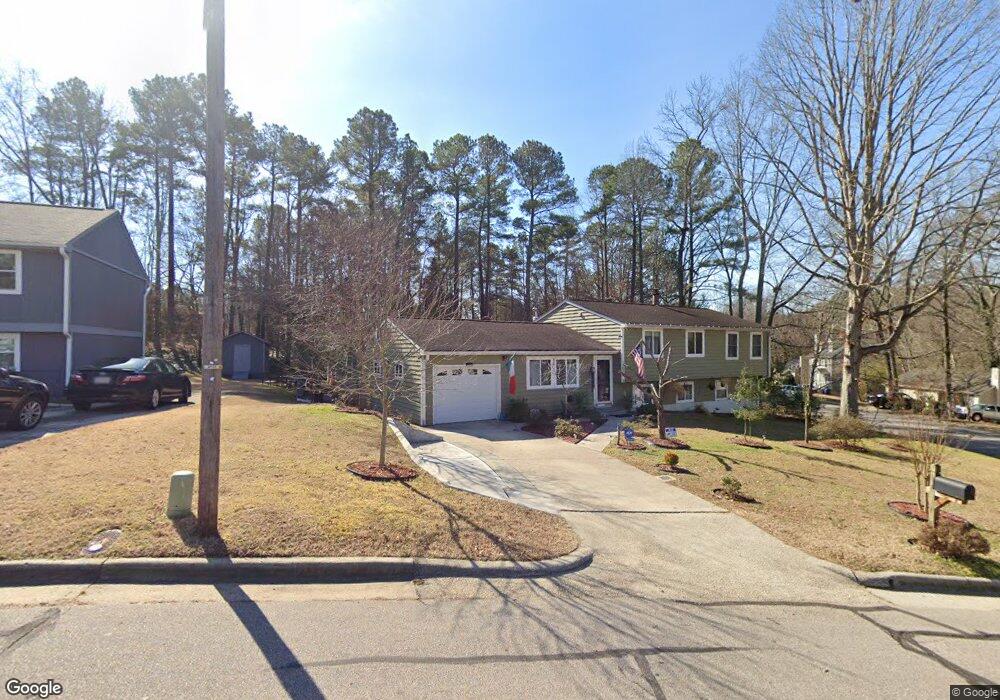
3800 Cascade Ct Raleigh, NC 27604
Atlantic NeighborhoodEstimated Value: $362,000 - $407,685
4
Beds
3
Baths
2,070
Sq Ft
$186/Sq Ft
Est. Value
About This Home
This home is located at 3800 Cascade Ct, Raleigh, NC 27604 and is currently estimated at $385,921, approximately $186 per square foot. 3800 Cascade Ct is a home located in Wake County with nearby schools including East Millbrook Middle, Heritage High School, and Raleigh Christian Academy.
Ownership History
Date
Name
Owned For
Owner Type
Purchase Details
Closed on
Jun 21, 2012
Sold by
Db50 2007-1 Trust
Bought by
Montalto Silvio
Current Estimated Value
Purchase Details
Closed on
Jan 7, 2012
Sold by
Hodges Christopher and Hodges Geanita
Bought by
Db50 2007-1 Trust
Purchase Details
Closed on
Jan 26, 2007
Sold by
Wells Fargo Bank Na
Bought by
Hodges Christopher and Hodges Geanita
Home Financials for this Owner
Home Financials are based on the most recent Mortgage that was taken out on this home.
Original Mortgage
$13,400
Interest Rate
5.86%
Mortgage Type
Stand Alone Second
Purchase Details
Closed on
May 19, 2006
Sold by
Day Ernestine
Bought by
Wells Fargo Bank Na
Purchase Details
Closed on
Oct 26, 2004
Sold by
Mcdowell Kenneth D and Mcdowell Gayle
Bought by
Day Ernestine
Home Financials for this Owner
Home Financials are based on the most recent Mortgage that was taken out on this home.
Original Mortgage
$113,400
Interest Rate
5%
Mortgage Type
Purchase Money Mortgage
Create a Home Valuation Report for This Property
The Home Valuation Report is an in-depth analysis detailing your home's value as well as a comparison with similar homes in the area
Home Values in the Area
Average Home Value in this Area
Purchase History
| Date | Buyer | Sale Price | Title Company |
|---|---|---|---|
| Montalto Silvio | $80,000 | None Available | |
| Db50 2007-1 Trust | $120,000 | None Available | |
| Hodges Christopher | $134,000 | None Available | |
| Wells Fargo Bank Na | $119,500 | None Available | |
| Day Ernestine | $162,000 | -- |
Source: Public Records
Mortgage History
| Date | Status | Borrower | Loan Amount |
|---|---|---|---|
| Previous Owner | Hodges Christopher | $13,400 | |
| Previous Owner | Hodges Christopher | $107,200 | |
| Previous Owner | Day Ernestine | $113,400 | |
| Closed | Day Ernestine | $40,500 |
Source: Public Records
Tax History Compared to Growth
Tax History
| Year | Tax Paid | Tax Assessment Tax Assessment Total Assessment is a certain percentage of the fair market value that is determined by local assessors to be the total taxable value of land and additions on the property. | Land | Improvement |
|---|---|---|---|---|
| 2025 | $3,090 | $352,045 | $140,000 | $212,045 |
| 2024 | $3,078 | $352,045 | $140,000 | $212,045 |
| 2023 | $2,231 | $202,814 | $55,000 | $147,814 |
| 2022 | $2,073 | $202,814 | $55,000 | $147,814 |
| 2021 | $1,993 | $202,814 | $55,000 | $147,814 |
| 2020 | $1,957 | $202,814 | $55,000 | $147,814 |
| 2019 | $2,027 | $173,207 | $50,000 | $123,207 |
| 2018 | $1,912 | $173,207 | $50,000 | $123,207 |
| 2017 | $1,822 | $173,207 | $50,000 | $123,207 |
| 2016 | $1,785 | $173,207 | $50,000 | $123,207 |
| 2015 | -- | $154,719 | $40,000 | $114,719 |
| 2014 | -- | $154,719 | $40,000 | $114,719 |
Source: Public Records
Map
Nearby Homes
- 3523 Greywood Dr
- 3701 Saratoga Dr
- 3531 Oneonta Ave
- 3608 Arrowwood Dr
- 3521 Arrowwood Dr
- 3700 Huntleigh Dr
- 3721 Baugh St
- 3605 Satellite Ct
- 3005 Huntleigh Dr
- 3749 Bison Hill Ln
- 3523 Brentwood Rd
- 3735 Bison Hill Ln
- 3117 Edgetone Dr
- 4236 Lake Ridge Dr Unit 11B
- 4204 Green Rd
- 3607 Buffaloe Rd
- 3700 Summer Place
- 3109 Crandon Ln
- 3408 Brentwood Rd
- 3635 Water Mist Ln
- 3804 Cascade Ct
- 3528 Greywood Dr
- 3801 Cascade Ct
- 3808 Cascade Ct
- 3111 Quinley Place
- 3109 Quinley Place
- 3529 Greywood Dr
- 3533 Greywood Dr
- 3 Greywood Dr
- 3805 Cascade Ct
- 3107 Quinley Place
- 3113 Quinley Place
- 3601 Greywood Dr
- 3527 Greywood Dr
- 3524 Greywood Dr
- 3105 Quinley Place
- 3812 Cascade Ct
- 3604 Greywood Dr
- 3115 Quinley Place
- 3525 Greywood Dr