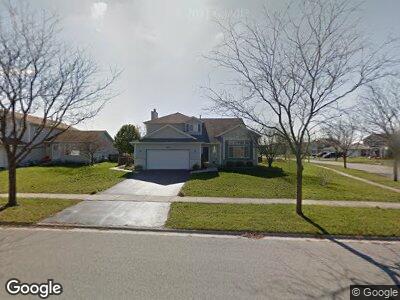
3800 Fallon Ln Joliet, IL 60431
Estimated Value: $349,000 - $372,396
3
Beds
3
Baths
2,046
Sq Ft
$175/Sq Ft
Est. Value
About This Home
This home is located at 3800 Fallon Ln, Joliet, IL 60431 and is currently estimated at $358,849, approximately $175 per square foot. 3800 Fallon Ln is a home located in Will County with nearby schools including Troy Craughwell Elementary School, Troy Middle School, and Orenic Intermediate School.
Ownership History
Date
Name
Owned For
Owner Type
Purchase Details
Closed on
Apr 10, 2017
Sold by
Smith Jamie L
Bought by
Diamond Emily A
Current Estimated Value
Home Financials for this Owner
Home Financials are based on the most recent Mortgage that was taken out on this home.
Original Mortgage
$198,850
Outstanding Balance
$168,107
Interest Rate
4.37%
Mortgage Type
New Conventional
Estimated Equity
$190,742
Purchase Details
Closed on
Oct 19, 2006
Sold by
Smith Craig A
Bought by
Smith Jamie L
Purchase Details
Closed on
Jun 3, 2003
Sold by
Southard Bradford L and Southard Erica A
Bought by
Smith Craig A and Smith Jamie L
Home Financials for this Owner
Home Financials are based on the most recent Mortgage that was taken out on this home.
Original Mortgage
$149,600
Interest Rate
5.51%
Mortgage Type
Purchase Money Mortgage
Create a Home Valuation Report for This Property
The Home Valuation Report is an in-depth analysis detailing your home's value as well as a comparison with similar homes in the area
Home Values in the Area
Average Home Value in this Area
Purchase History
| Date | Buyer | Sale Price | Title Company |
|---|---|---|---|
| Diamond Emily A | $205,000 | Fidelity National Title Ins | |
| Smith Jamie L | -- | None Available | |
| Smith Craig A | $187,000 | Ticor Title |
Source: Public Records
Mortgage History
| Date | Status | Borrower | Loan Amount |
|---|---|---|---|
| Open | Diamond Emily A | $198,850 | |
| Previous Owner | Smith Jamie L | $18,500 | |
| Previous Owner | Smith Jamie L | $139,250 | |
| Previous Owner | Smith Jamie L | $144,000 | |
| Previous Owner | Smith Jamie L | $145,000 | |
| Previous Owner | Smith Craig A | $149,600 | |
| Previous Owner | Southard Bradford L | $56,644 | |
| Previous Owner | Southard Bradford L | $152,300 |
Source: Public Records
Tax History Compared to Growth
Tax History
| Year | Tax Paid | Tax Assessment Tax Assessment Total Assessment is a certain percentage of the fair market value that is determined by local assessors to be the total taxable value of land and additions on the property. | Land | Improvement |
|---|---|---|---|---|
| 2023 | $8,258 | $91,696 | $15,634 | $76,062 |
| 2022 | $7,240 | $84,000 | $14,794 | $69,206 |
| 2021 | $6,785 | $79,021 | $13,917 | $65,104 |
| 2020 | $6,794 | $79,021 | $13,917 | $65,104 |
| 2019 | $6,589 | $75,800 | $13,350 | $62,450 |
| 2018 | $6,702 | $74,900 | $13,350 | $61,550 |
| 2017 | $6,491 | $71,450 | $13,350 | $58,100 |
| 2016 | $6,314 | $67,400 | $13,350 | $54,050 |
| 2015 | $6,197 | $63,668 | $12,018 | $51,650 |
| 2014 | $6,197 | $60,668 | $12,018 | $48,650 |
| 2013 | $6,197 | $67,546 | $12,018 | $55,528 |
Source: Public Records
Map
Nearby Homes
- 3737 Pandola Ave
- 1339 Addleman St
- 1332 Jane Ct
- 3831 Juniper Ave
- 613 Rookery Ln
- 3700 Theodore St
- 3518 Theodore St
- 4320 Odonohue Dr
- 4328 Osullivan Dr
- 708 Timberline Dr
- 3416 Bankview Dr
- 1518 Parkside Dr
- 1614 N Autumn Dr Unit 1
- 3019 Harris Dr
- 1105 Kerry Ln
- 410 Rollingwood Ln Unit 1
- 4309 Ashcott Ln
- Lot 48 Murphy Dr
- 4305 Anthony Ln
- 3111 Ingalls Ave Unit 3D
- 3800 Fallon Ln
- 3738 Fallon Ln
- 1014 Lindsay St
- 3736 Fallon Ln
- 1103 Lindsay St
- 1012 Lindsay St
- 1105 Lindsay St
- 3801 Fallon Ln
- 1101 Lindsay St
- 3743 Fallon Ln
- 3734 Fallon Ln
- 1011 Addleman St
- 1015 Lindsay St
- 1107 Lindsay St
- 1013 Addleman St Unit 3
- 1013 Lindsay St
- 1009 Addleman St
- 3741 Fallon Ln
- 3732 Fallon Ln
- 1109 Lindsay St