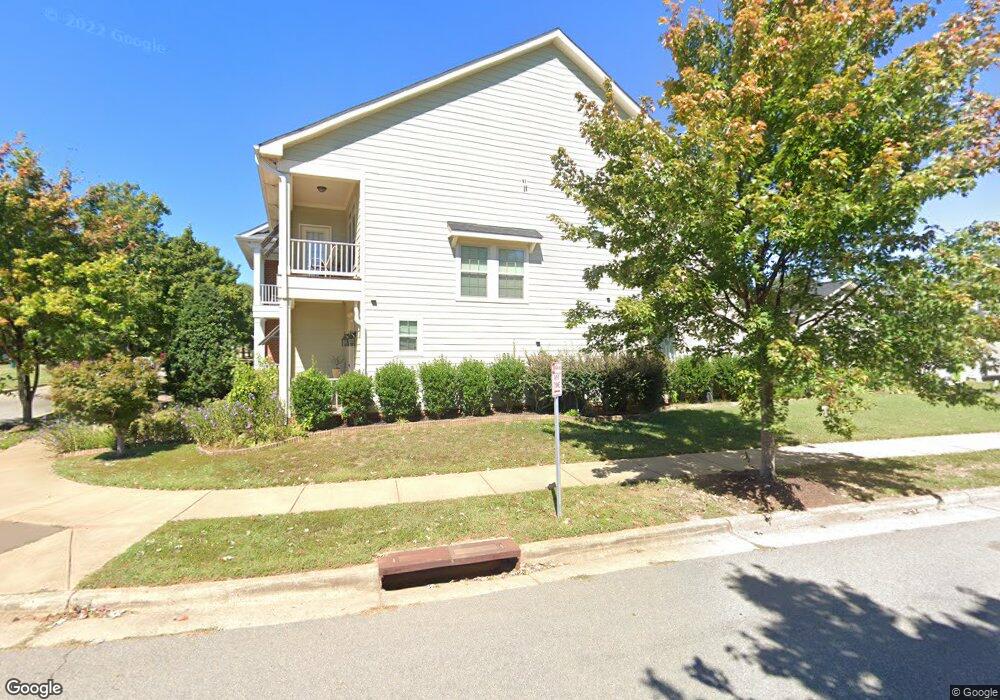
3800 Olympia Dr Raleigh, NC 27603
Renaissance Park NeighborhoodEstimated Value: $559,000 - $611,000
--
Bed
1
Bath
2,354
Sq Ft
$248/Sq Ft
Est. Value
About This Home
This home is located at 3800 Olympia Dr, Raleigh, NC 27603 and is currently estimated at $583,838, approximately $248 per square foot. 3800 Olympia Dr is a home with nearby schools including Smith Elementary, North Garner Middle, and Garner High.
Ownership History
Date
Name
Owned For
Owner Type
Purchase Details
Closed on
Feb 11, 2025
Sold by
Bishop Chong I
Bought by
Bishop John Wayne
Current Estimated Value
Home Financials for this Owner
Home Financials are based on the most recent Mortgage that was taken out on this home.
Original Mortgage
$175,000
Outstanding Balance
$173,964
Interest Rate
6.93%
Mortgage Type
New Conventional
Estimated Equity
$409,874
Purchase Details
Closed on
May 23, 2018
Sold by
Bishop Chong I
Bought by
Bishop Chomg I and Bishop John
Purchase Details
Closed on
Sep 8, 2014
Bought by
Bishop Chong I
Purchase Details
Closed on
Feb 11, 2014
Sold by
Morris Cynthia S
Bought by
Cm South Properties Llc
Purchase Details
Closed on
Nov 5, 2010
Sold by
Winstar Homes At Renaissance Park Llc
Bought by
Morris Cynthia S
Purchase Details
Closed on
Nov 4, 2010
Sold by
Amelia Park L L C
Bought by
Winstar Homes At Renaissance Park Llc
Create a Home Valuation Report for This Property
The Home Valuation Report is an in-depth analysis detailing your home's value as well as a comparison with similar homes in the area
Home Values in the Area
Average Home Value in this Area
Purchase History
| Date | Buyer | Sale Price | Title Company |
|---|---|---|---|
| Bishop John Wayne | -- | None Listed On Document | |
| Bishop John Wayne | -- | None Listed On Document | |
| Bishop Chomg I | -- | None Available | |
| Bishop Chong I | $307,000 | -- | |
| Cm South Properties Llc | -- | None Available | |
| Morris Cynthia S | $60,000 | None Available | |
| Winstar Homes At Renaissance Park Llc | $62,000 | None Available |
Source: Public Records
Mortgage History
| Date | Status | Borrower | Loan Amount |
|---|---|---|---|
| Open | Bishop John Wayne | $175,000 | |
| Closed | Bishop John Wayne | $175,000 |
Source: Public Records
Tax History Compared to Growth
Tax History
| Year | Tax Paid | Tax Assessment Tax Assessment Total Assessment is a certain percentage of the fair market value that is determined by local assessors to be the total taxable value of land and additions on the property. | Land | Improvement |
|---|---|---|---|---|
| 2025 | $5,179 | $591,565 | $110,000 | $481,565 |
| 2024 | $5,158 | $591,565 | $110,000 | $481,565 |
| 2023 | $4,145 | $378,423 | $65,000 | $313,423 |
| 2022 | $3,852 | $378,423 | $65,000 | $313,423 |
| 2021 | $3,702 | $378,423 | $65,000 | $313,423 |
| 2020 | $3,635 | $378,423 | $65,000 | $313,423 |
| 2019 | $3,491 | $299,469 | $60,000 | $239,469 |
| 2018 | $3,292 | $299,469 | $60,000 | $239,469 |
| 2017 | $3,135 | $299,469 | $60,000 | $239,469 |
| 2016 | $3,071 | $299,469 | $60,000 | $239,469 |
| 2015 | $3,212 | $308,220 | $60,000 | $248,220 |
| 2014 | -- | $60,000 | $60,000 | $0 |
Source: Public Records
Map
Nearby Homes
- 831 Historian St
- 1204 Chapanoke Rd
- 1229 Chapanoke Rd
- 1300 Formal Garden Way
- 800 Chapanoke Rd
- 653 Democracy St
- 3636 Olympia Dr
- 3634 Olympia Dr
- 513 Dragby Ln
- 1314 Still Monument Way
- 3616 Olympia Dr
- 648 Cupola Dr
- 601 Cupola Dr
- 948 Consortium Dr
- 412 Stone Flower Ln
- 852 Cupola Dr
- 1625 Bruce Cir
- 728 Cupola Dr
- 1626 Bruce Cir
- 1120 Renewal Place Unit 113
- 3804 Olympia Dr
- 3808 Olympia Dr
- 3812 Olympia Dr
- 801 Historian St
- 811 Historian St
- 1361 Formal Garden Way
- 1357 Formal Garden Way
- 3816 Olympia Dr
- 815 Historian St
- 1353 Formal Garden Way
- 1349 Formal Garden Way
- 819 Historian St
- 3820 Olympia Dr
- 823 Historian St
- 3735 Olympia Dr
- 3801 Olympia Dr
- 3805 Olympia Dr
- 3824 Olympia Dr
- 1345 Formal Garden Way
- 827 Historian St