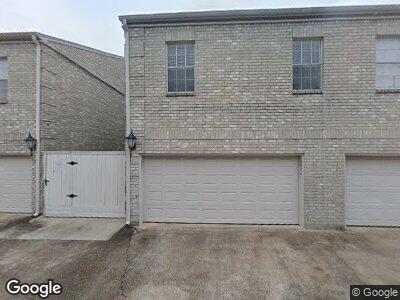
3800 Tanglewilde St Unit 107 Houston, TX 77063
Mid West NeighborhoodEstimated Value: $157,148 - $174,000
2
Beds
3
Baths
1,428
Sq Ft
$116/Sq Ft
Est. Value
About This Home
This home is located at 3800 Tanglewilde St Unit 107, Houston, TX 77063 and is currently estimated at $165,787, approximately $116 per square foot. 3800 Tanglewilde St Unit 107 is a home located in Harris County with nearby schools including Emerson Elementary School, Paul Revere Middle School, and Wisdom High School.
Ownership History
Date
Name
Owned For
Owner Type
Purchase Details
Closed on
Sep 14, 2023
Sold by
Seth Aman Bob
Bought by
Trust Of Aman Bob Seth and Seth
Current Estimated Value
Purchase Details
Closed on
May 20, 2011
Sold by
Fannie Mae
Bought by
Velazquez Antulio
Purchase Details
Closed on
Apr 21, 2011
Sold by
Greentree Servicing Llc
Bought by
Federal National Mortgage Association
Purchase Details
Closed on
Mar 2, 2011
Sold by
Rizvi Samira B and Rizvi Raza B
Bought by
Green Tree Servicing Llc
Purchase Details
Closed on
Nov 27, 2007
Sold by
Mcknight Tara
Bought by
Rizvi Samira B and Rizvi Raza B
Home Financials for this Owner
Home Financials are based on the most recent Mortgage that was taken out on this home.
Original Mortgage
$101,000
Interest Rate
6.43%
Mortgage Type
Purchase Money Mortgage
Create a Home Valuation Report for This Property
The Home Valuation Report is an in-depth analysis detailing your home's value as well as a comparison with similar homes in the area
Home Values in the Area
Average Home Value in this Area
Purchase History
| Date | Buyer | Sale Price | Title Company |
|---|---|---|---|
| Trust Of Aman Bob Seth | -- | None Listed On Document | |
| Velazquez Antulio | -- | None Available | |
| Federal National Mortgage Association | -- | Excel Title | |
| Green Tree Servicing Llc | $92,000 | None Available | |
| Rizvi Samira B | -- | Chicago Title |
Source: Public Records
Mortgage History
| Date | Status | Borrower | Loan Amount |
|---|---|---|---|
| Previous Owner | Rizvi Samira B | $101,000 | |
| Previous Owner | Brown Linda Sue | $81,950 |
Source: Public Records
Tax History Compared to Growth
Tax History
| Year | Tax Paid | Tax Assessment Tax Assessment Total Assessment is a certain percentage of the fair market value that is determined by local assessors to be the total taxable value of land and additions on the property. | Land | Improvement |
|---|---|---|---|---|
| 2023 | $3,458 | $153,417 | $29,149 | $124,268 |
| 2022 | $3,156 | $143,338 | $27,234 | $116,104 |
| 2021 | $2,987 | $128,148 | $24,348 | $103,800 |
| 2020 | $3,223 | $133,093 | $25,288 | $107,805 |
| 2019 | $2,972 | $117,442 | $22,314 | $95,128 |
| 2018 | $2,902 | $114,681 | $21,789 | $92,892 |
| 2017 | $2,900 | $114,681 | $21,789 | $92,892 |
| 2016 | $2,900 | $114,681 | $21,789 | $92,892 |
| 2015 | $2,463 | $110,157 | $20,930 | $89,227 |
| 2014 | $2,463 | $95,804 | $18,203 | $77,601 |
Source: Public Records
Map
Nearby Homes
- 3800 Tanglewilde St Unit 504
- 3800 Tanglewilde St Unit 802
- 3780 Tanglewilde St Unit 501
- 3754 Tanglewilde St Unit 9
- 4001 Tanglewilde St Unit 304
- 4001 Tanglewilde St Unit 1103
- 4001 Tanglewilde St Unit 1204
- 3768 Tanglewilde St Unit J5
- 3764 Tanglewilde St Unit 7
- 3921 Tanglewilde St Unit 3921
- 3833 Tanglewilde St Unit 3833
- 3801 Tanglewilde St Unit 3801
- 9527 Windswept Ln Unit 9527
- 9501 Windswept Ln Unit 9501
- 9521 Windswept Ln Unit 9521
- 8722 Windswept Ln
- 9502 Windswept Ln Unit 9502
- 9606 Pagewood Ln
- 9566 Windswept Ln Unit 9566
- 9537 Pagewood Ln Unit 9537
- 3800 Tanglewilde St Unit 804
- 3800 Tanglewilde St Unit 605
- 3800 Tanglewilde St Unit 103
- 3800 Tanglewilde St Unit 406
- 3800 Tanglewilde St Unit 803
- 3800 Tanglewilde St Unit 305
- 3800 Tanglewilde St Unit 1008
- 3800 Tanglewilde St Unit 304
- 3800 Tanglewilde St Unit 1006
- 3800 Tanglewilde St Unit 209
- 3800 Tanglewilde St Unit 1007
- 3800 Tanglewilde St Unit 107
- 3800 Tanglewilde St Unit 908
- 3800 Tanglewilde St Unit 505
- 3800 Tanglewilde St Unit 202
- 3800 Tanglewilde St Unit 203
- 3800 Tanglewilde St Unit 402
- 3800 Tanglewilde St Unit 801
- 3800 Tanglewilde St Unit 207
- 3800 Tanglewilde St Unit 204