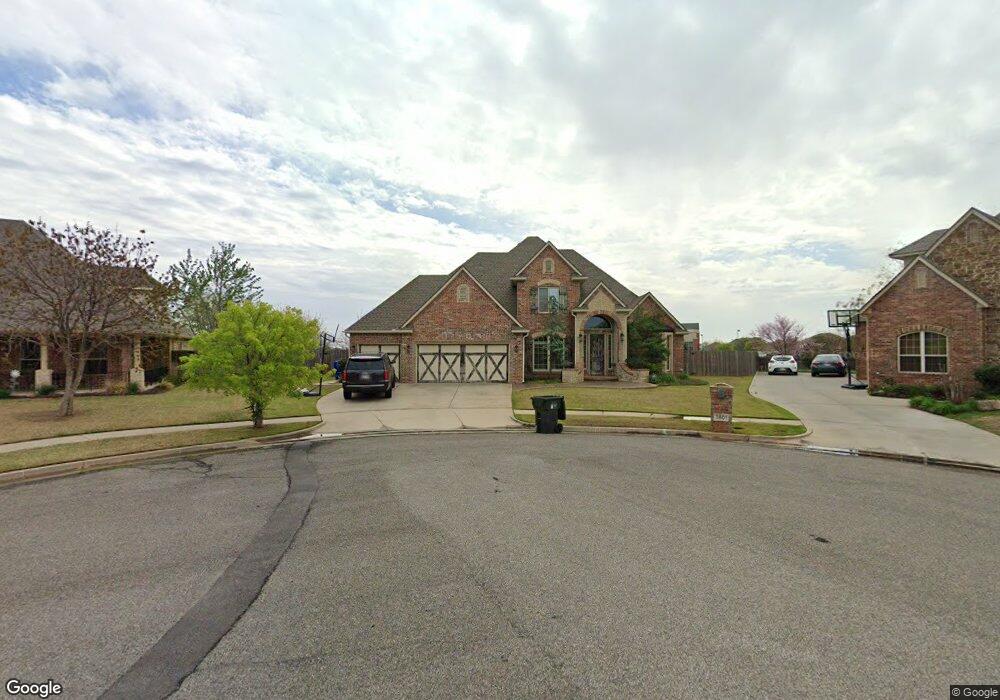
3801 Dalston Cir Norman, OK 73072
Northwest Norman NeighborhoodEstimated Value: $516,598 - $592,000
4
Beds
4
Baths
2,884
Sq Ft
$192/Sq Ft
Est. Value
About This Home
This home is located at 3801 Dalston Cir, Norman, OK 73072 and is currently estimated at $553,400, approximately $191 per square foot. 3801 Dalston Cir is a home located in Cleveland County with nearby schools including Roosevelt Elementary School, Whittier Middle School, and Norman North High School.
Ownership History
Date
Name
Owned For
Owner Type
Purchase Details
Closed on
Jul 21, 2010
Sold by
Cox Joe C and Cox Teka
Bought by
Cox Craig and Cox Teka
Current Estimated Value
Home Financials for this Owner
Home Financials are based on the most recent Mortgage that was taken out on this home.
Original Mortgage
$368,000
Outstanding Balance
$244,663
Interest Rate
4.73%
Mortgage Type
New Conventional
Estimated Equity
$308,737
Purchase Details
Closed on
Dec 5, 2006
Sold by
Riccarty Investkments Llc
Bought by
Cox Joe C
Home Financials for this Owner
Home Financials are based on the most recent Mortgage that was taken out on this home.
Original Mortgage
$393,863
Interest Rate
6.41%
Mortgage Type
New Conventional
Purchase Details
Closed on
Mar 13, 2006
Sold by
Carrington Place Llc
Bought by
Riccarty Investments Llc
Home Financials for this Owner
Home Financials are based on the most recent Mortgage that was taken out on this home.
Original Mortgage
$319,760
Interest Rate
6.19%
Mortgage Type
Future Advance Clause Open End Mortgage
Create a Home Valuation Report for This Property
The Home Valuation Report is an in-depth analysis detailing your home's value as well as a comparison with similar homes in the area
Home Values in the Area
Average Home Value in this Area
Purchase History
| Date | Buyer | Sale Price | Title Company |
|---|---|---|---|
| Cox Craig | -- | Or | |
| Cox Joe C | $415,000 | None Available | |
| Riccarty Investments Llc | $67,000 | None Available |
Source: Public Records
Mortgage History
| Date | Status | Borrower | Loan Amount |
|---|---|---|---|
| Open | Cox Craig | $368,000 | |
| Closed | Cox Joe C | $393,863 | |
| Previous Owner | Riccarty Investments Llc | $319,760 |
Source: Public Records
Tax History Compared to Growth
Tax History
| Year | Tax Paid | Tax Assessment Tax Assessment Total Assessment is a certain percentage of the fair market value that is determined by local assessors to be the total taxable value of land and additions on the property. | Land | Improvement |
|---|---|---|---|---|
| 2024 | $5,029 | $42,987 | $8,539 | $34,448 |
| 2023 | $4,891 | $41,735 | $8,673 | $33,062 |
| 2022 | $4,551 | $40,519 | $7,800 | $32,719 |
| 2021 | $4,798 | $40,519 | $7,800 | $32,719 |
| 2020 | $4,695 | $40,519 | $7,800 | $32,719 |
| 2019 | $4,774 | $40,519 | $7,800 | $32,719 |
| 2018 | $4,631 | $40,520 | $7,800 | $32,720 |
| 2017 | $4,682 | $40,520 | $0 | $0 |
| 2016 | $4,759 | $40,520 | $7,800 | $32,720 |
| 2015 | $4,616 | $40,520 | $7,800 | $32,720 |
| 2014 | $4,547 | $39,552 | $7,800 | $31,752 |
Source: Public Records
Map
Nearby Homes
- 3705 Dalston Cir
- 4401 Cannon Dr
- 4311 Moorgate Dr
- 4312 Moorgate Dr
- 4116 Carrington Ln
- Preston Plan at Carrington Lakes
- Logan Plan at Carrington Lakes
- Collin Plan at Carrington Lakes
- Ellie Plan at Carrington Lakes
- Emma Plan at Carrington Lakes
- Saddie Plan at Carrington Lakes
- Hudson Plan at Carrington Lakes
- Patrick Plan at Carrington Lakes
- Elle Plan at Carrington Lakes
- Lyla Plan at Carrington Lakes
- Ledger Plan at Carrington Lakes
- Nellie Plan at Carrington Lakes
- Lincoln Plan at Carrington Lakes
- Charli Plan at Carrington Lakes
- Teagan Plan at Carrington Lakes
- 3700 Dalston Cir
- 3805 Dalston Cir
- 3704 Dalston Cir
- 3701 Dalston Cir
- 3809 Dalston Cir
- 3921 Pimlico Dr
- 3917 Pimlico Dr
- 3913 Pimlico Dr
- 3812 Dalston Cir
- 3709 Dalston Cir
- 3909 Pimlico Dr
- 3816 Dalston Cir
- 3817 Dalston Cir
- 3929 Pimlico Dr
- 3924 Pimlico Dr
- 3912 Pimlico Dr
- 3901 Pimlico Dr
- 3928 Pimlico Dr
- 4509 Canonbury Cir
- 4417 Warrington Way