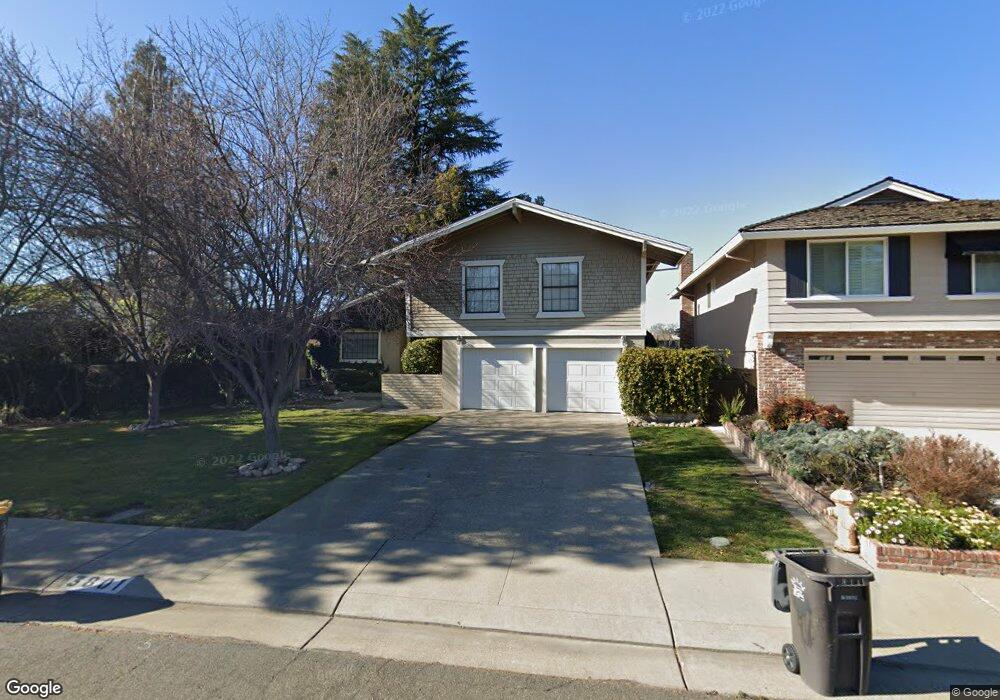
3801 N Monitor Cir Stockton, CA 95219
Lincoln Village West NeighborhoodEstimated Value: $244,000 - $527,000
3
Beds
3
Baths
1,974
Sq Ft
$222/Sq Ft
Est. Value
About This Home
This home is located at 3801 N Monitor Cir, Stockton, CA 95219 and is currently estimated at $437,324, approximately $221 per square foot. 3801 N Monitor Cir is a home located in San Joaquin County with nearby schools including Mable Barron, Sierra Middle School, and Lincoln High School.
Ownership History
Date
Name
Owned For
Owner Type
Purchase Details
Closed on
Apr 15, 2003
Sold by
Monroe Paula
Bought by
Monroe Paula and The Monroe Living Trust
Current Estimated Value
Purchase Details
Closed on
Jul 23, 2001
Sold by
Saunders Ramona and Estate Of Patricia Ann Yost
Bought by
Monroe Paula
Home Financials for this Owner
Home Financials are based on the most recent Mortgage that was taken out on this home.
Original Mortgage
$190,800
Outstanding Balance
$69,407
Interest Rate
6.37%
Estimated Equity
$367,917
Purchase Details
Closed on
Oct 4, 2000
Sold by
Dominguez Antonia
Bought by
Dominguez Ralph and Dominguez Antonia
Purchase Details
Closed on
Oct 29, 1997
Sold by
Eger June A Survivors Trust and Frank L
Bought by
Yost Walter K and Yost Patricia A
Home Financials for this Owner
Home Financials are based on the most recent Mortgage that was taken out on this home.
Original Mortgage
$109,600
Interest Rate
7.36%
Create a Home Valuation Report for This Property
The Home Valuation Report is an in-depth analysis detailing your home's value as well as a comparison with similar homes in the area
Home Values in the Area
Average Home Value in this Area
Purchase History
| Date | Buyer | Sale Price | Title Company |
|---|---|---|---|
| Monroe Paula | -- | -- | |
| Monroe Paula | $238,500 | Old Republic Title Company | |
| Dominguez Ralph | -- | Chicago Title Co | |
| Yost Walter K | $137,000 | First American Title Co |
Source: Public Records
Mortgage History
| Date | Status | Borrower | Loan Amount |
|---|---|---|---|
| Open | Monroe Paula | $190,800 | |
| Previous Owner | Yost Walter K | $109,600 |
Source: Public Records
Tax History Compared to Growth
Tax History
| Year | Tax Paid | Tax Assessment Tax Assessment Total Assessment is a certain percentage of the fair market value that is determined by local assessors to be the total taxable value of land and additions on the property. | Land | Improvement |
|---|---|---|---|---|
| 2025 | $2,044 | $156,634 | $52,087 | $104,547 |
| 2024 | $1,933 | $153,564 | $51,066 | $102,498 |
| 2023 | $1,971 | $150,554 | $50,065 | $100,489 |
| 2022 | $1,763 | $147,603 | $49,084 | $98,519 |
| 2021 | $1,740 | $144,710 | $48,122 | $96,588 |
| 2020 | $1,738 | $143,227 | $47,629 | $95,598 |
| 2019 | $1,711 | $140,420 | $46,696 | $93,724 |
| 2018 | $1,681 | $137,668 | $45,781 | $91,887 |
| 2017 | $1,647 | $134,970 | $44,884 | $90,086 |
| 2016 | $1,630 | $132,325 | $44,005 | $88,320 |
| 2014 | $1,593 | $127,784 | $42,495 | $85,289 |
Source: Public Records
Map
Nearby Homes
- 3708 N Merrimac Cir
- 6412 Embarcadero Dr
- 6610 Embarcadero Dr Unit 7
- 6123 Cumberland Place
- 3722 W Benjamin Holt Dr Unit 7
- 3722 W Benjamin Holt Dr Unit 16
- 3533 Harpers Ferry Dr
- 6669 Embarcadero Dr Unit 16
- 6669 Embarcadero Dr Unit 2
- 6713 Embarcadero Dr Unit 29
- 4233 Five Mile Dr
- 6213 Embarcadero Dr
- 3928 Waynesboro Ct Unit 41
- 3827 Fourteen Mile Dr
- 3864 Fourteen Mile Dr
- 3216 Polk Way
- 3115 Polk Way
- 6078 Carolina Cir
- 3102 W Swain Rd
- 6827 Shiloh Ct
- 3801 N Monitor Cir
- 3749 N Monitor Cir
- 3817 N Monitor Cir
- 3817 N Monitor Cir
- 3741 N Monitor Cir
- 3825 N Monitor Cir
- 3825 N Monitor Cir
- 3804 N Monitor Cir
- 3733 N Monitor Cir
- 3725 N Monitor Cir
- 6419 Monitor Place
- 3833 N Monitor Cir
- 3816 N Monitor Cir
- 3820 N Monitor Cir
- 3728 N Monitor Cir
- 3828 N Monitor Cir
- 6415 Monitor Place
- 3832 N Monitor Cir
- 3721 N Monitor Cir
- 3721 N Monitor Cir