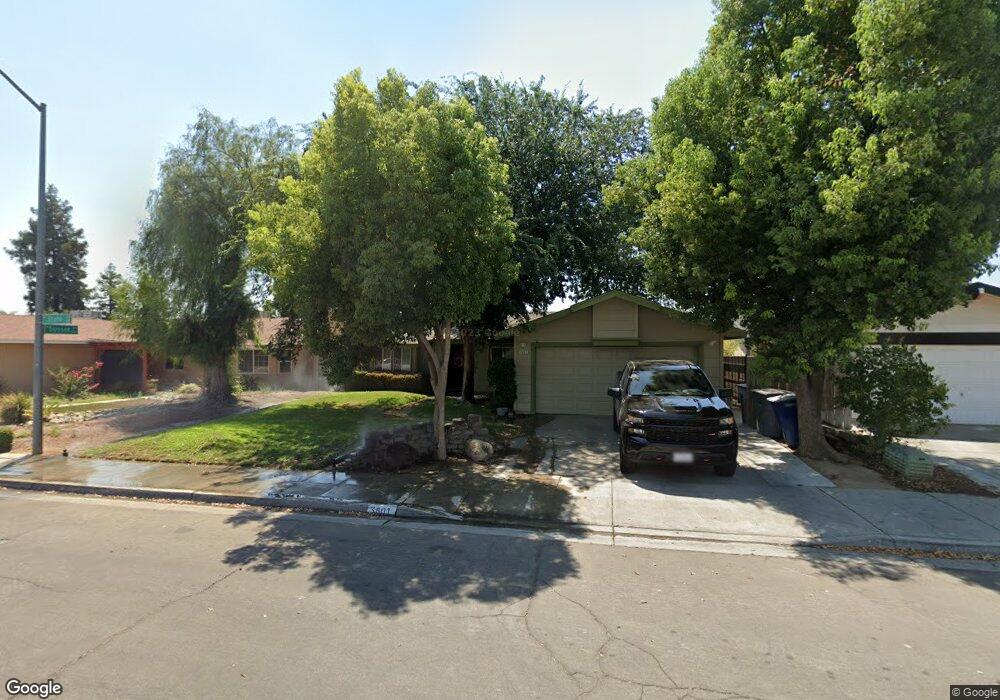
3801 N State St Fresno, CA 93722
West Fresno NeighborhoodEstimated Value: $309,000 - $336,000
3
Beds
2
Baths
1,204
Sq Ft
$270/Sq Ft
Est. Value
About This Home
This home is located at 3801 N State St, Fresno, CA 93722 and is currently estimated at $325,310, approximately $270 per square foot. 3801 N State St is a home located in Fresno County with nearby schools including Harvest Elementary School, Glacier Point Middle School, and Aspen Valley Prep Academy.
Ownership History
Date
Name
Owned For
Owner Type
Purchase Details
Closed on
May 23, 2018
Sold by
Joaquin Santiago Living Trust
Bought by
Santiago Jose Esau
Current Estimated Value
Home Financials for this Owner
Home Financials are based on the most recent Mortgage that was taken out on this home.
Original Mortgage
$133,600
Outstanding Balance
$115,034
Interest Rate
4.4%
Mortgage Type
New Conventional
Estimated Equity
$210,276
Purchase Details
Closed on
Aug 22, 2014
Sold by
Santiago Joaquin
Bought by
The Joaquin Santiago Living Trust and Santiago Joaquin
Purchase Details
Closed on
Mar 25, 1996
Sold by
Santiago Jose
Bought by
Santiago Joaquin
Home Financials for this Owner
Home Financials are based on the most recent Mortgage that was taken out on this home.
Original Mortgage
$92,208
Interest Rate
6.48%
Mortgage Type
FHA
Create a Home Valuation Report for This Property
The Home Valuation Report is an in-depth analysis detailing your home's value as well as a comparison with similar homes in the area
Home Values in the Area
Average Home Value in this Area
Purchase History
| Date | Buyer | Sale Price | Title Company |
|---|---|---|---|
| Santiago Jose Esau | $167,000 | North American Title Company | |
| Santiago Jose Esau | -- | North American Title Company | |
| The Joaquin Santiago Living Trust | -- | None Available | |
| Santiago Joaquin | -- | Central Title Company |
Source: Public Records
Mortgage History
| Date | Status | Borrower | Loan Amount |
|---|---|---|---|
| Open | Santiago Jose Esau | $133,600 | |
| Previous Owner | Santiago Joaquin | $92,208 |
Source: Public Records
Tax History Compared to Growth
Tax History
| Year | Tax Paid | Tax Assessment Tax Assessment Total Assessment is a certain percentage of the fair market value that is determined by local assessors to be the total taxable value of land and additions on the property. | Land | Improvement |
|---|---|---|---|---|
| 2025 | $2,306 | $190,012 | $57,003 | $133,009 |
| 2023 | $2,255 | $182,636 | $54,791 | $127,845 |
| 2022 | $2,126 | $179,056 | $53,717 | $125,339 |
| 2021 | $2,141 | $175,546 | $52,664 | $122,882 |
| 2020 | $2,035 | $173,746 | $52,124 | $121,622 |
| 2019 | $2,002 | $170,340 | $51,102 | $119,238 |
| 2018 | $1,765 | $144,232 | $45,201 | $99,031 |
| 2017 | $1,771 | $141,405 | $44,315 | $97,090 |
| 2016 | $1,632 | $138,634 | $43,447 | $95,187 |
| 2015 | $1,625 | $136,553 | $42,795 | $93,758 |
| 2014 | $1,541 | $133,879 | $41,957 | $91,922 |
Source: Public Records
Map
Nearby Homes
- 5443 W Flint Way
- 3864 N Forestiere Ave
- 5566 W Farrin Ave
- 3689 N Mccaffrey Ave
- 5314 W Ramona Ave
- 5958 W Austin Way
- 4739 W Bellaire Way
- 5044 W Willis Ave
- 5323 W Garland Ave
- 5028 W Robinson Ave
- 5252 W Holland Ave
- 5769 W Austin Way
- 5761 W Willis Ave
- 3340 N Dante Ave
- 3292 N Wheeler Ave
- 4626 W Javier Way
- 4614 W Javier Way
- 4292 N Gregory Ave
- 4387 N Ellendale Ave
- 4435 N Cornelia Ave
- 3813 N State St
- 3789 N State St
- 3825 N State St
- 3777 N State St
- 5334 W Sussex Way
- 5333 W Sussex Way
- 5382 W Griffith Way
- 3837 N State St
- 3765 N State St
- 5321 W Sussex Way
- 5322 W Sussex Way
- 5335 W Hampton Way
- 5336 W Griffith Way
- 5394 W Griffith Way
- 3849 N State St
- 3753 N State St
- 5381 W Griffith Way
- 5309 W Sussex Way
- 5310 W Sussex Way
- 5323 W Hampton Way