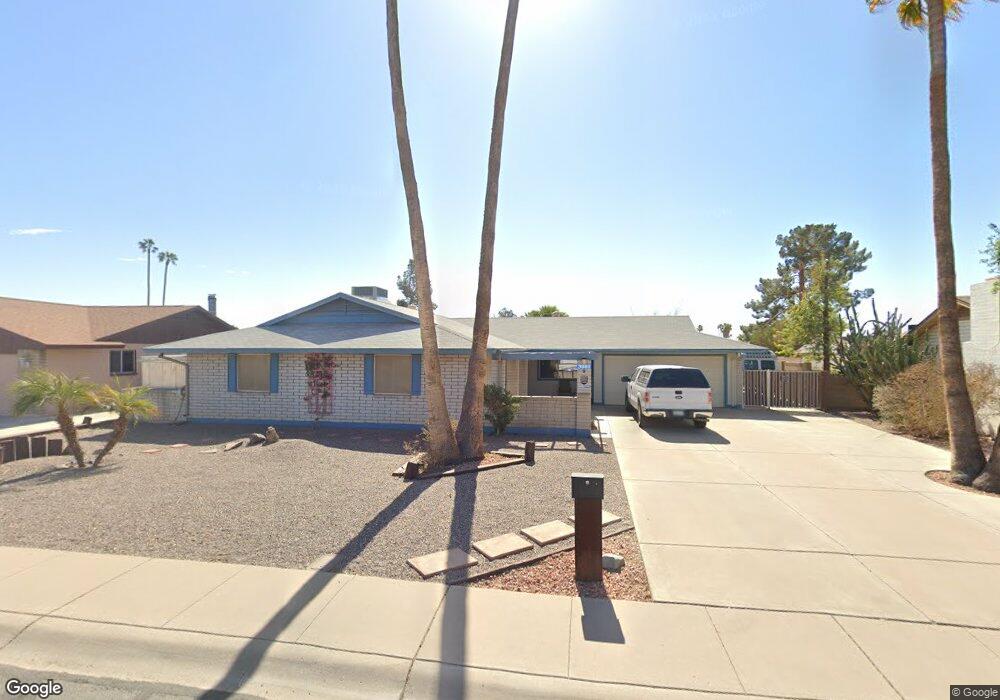
3801 W Yucca St Phoenix, AZ 85029
North Mountain Village NeighborhoodEstimated Value: $317,337 - $452,000
--
Bed
2
Baths
1,821
Sq Ft
$221/Sq Ft
Est. Value
About This Home
This home is located at 3801 W Yucca St, Phoenix, AZ 85029 and is currently estimated at $402,834, approximately $221 per square foot. 3801 W Yucca St is a home located in Maricopa County with nearby schools including Tumbleweed Elementary School, Cholla Middle School, and Moon Valley High School.
Ownership History
Date
Name
Owned For
Owner Type
Purchase Details
Closed on
Aug 22, 2024
Sold by
Shortsleeve Jeffrey D and Shortsleeve Lezlie O
Bought by
Shortsleeve Jeffrey D
Current Estimated Value
Home Financials for this Owner
Home Financials are based on the most recent Mortgage that was taken out on this home.
Original Mortgage
$223,273
Outstanding Balance
$220,756
Interest Rate
6.89%
Mortgage Type
New Conventional
Estimated Equity
$182,078
Purchase Details
Closed on
May 17, 1994
Sold by
Deal Phyllis E
Bought by
Shortsleeve Jeffrey D and Shortsleeve Lezlie O
Home Financials for this Owner
Home Financials are based on the most recent Mortgage that was taken out on this home.
Original Mortgage
$70,400
Interest Rate
8.56%
Mortgage Type
New Conventional
Create a Home Valuation Report for This Property
The Home Valuation Report is an in-depth analysis detailing your home's value as well as a comparison with similar homes in the area
Home Values in the Area
Average Home Value in this Area
Purchase History
| Date | Buyer | Sale Price | Title Company |
|---|---|---|---|
| Shortsleeve Jeffrey D | -- | None Listed On Document | |
| Shortsleeve Jeffrey D | $92,000 | Transamerica Title Ins Co |
Source: Public Records
Mortgage History
| Date | Status | Borrower | Loan Amount |
|---|---|---|---|
| Open | Shortsleeve Jeffrey D | $223,273 | |
| Previous Owner | Shortsleeve Jeffrey D | $70,400 |
Source: Public Records
Tax History Compared to Growth
Tax History
| Year | Tax Paid | Tax Assessment Tax Assessment Total Assessment is a certain percentage of the fair market value that is determined by local assessors to be the total taxable value of land and additions on the property. | Land | Improvement |
|---|---|---|---|---|
| 2025 | $1,248 | $11,194 | -- | -- |
| 2024 | $1,176 | $10,661 | -- | -- |
| 2023 | $1,176 | $27,650 | $5,530 | $22,120 |
| 2022 | $1,135 | $21,230 | $4,240 | $16,990 |
| 2021 | $1,163 | $19,510 | $3,900 | $15,610 |
| 2020 | $1,132 | $18,210 | $3,640 | $14,570 |
| 2019 | $1,111 | $16,180 | $3,230 | $12,950 |
| 2018 | $1,080 | $15,080 | $3,010 | $12,070 |
| 2017 | $1,077 | $13,310 | $2,660 | $10,650 |
| 2016 | $1,058 | $12,530 | $2,500 | $10,030 |
| 2015 | $981 | $12,070 | $2,410 | $9,660 |
Source: Public Records
Map
Nearby Homes
- 3810 W Yucca St
- 3824 W Shangri la Rd
- 3736 W Mercer Ln
- 3836 W Desert Cove Ave
- 11220 N 37th Ave
- 3654 W Shangri la Rd
- 3807 W Mercer Ln
- 3802 W Sahuaro Dr
- 3915 W Cholla St
- 3743 W Sahuaro Dr
- 10841 N 39th Dr
- 3844 W Lupine Ave
- 3734 W Becker Ln
- 10801 N 37th Dr
- 3840 W Sierra St
- 3926 W Sahuaro Dr
- 3527 W Yucca St
- 10719 N 36th Ave
- 11615 N 39th Dr
- 3741 W Poinsettia Dr
- 3749 W Yucca St
- 3809 W Yucca St
- 3802 W Shangri la Rd
- 3750 W Shangri la Rd
- 3741 W Yucca St
- 3806 W Shangri la Rd
- 3815 W Yucca St
- 3742 W Shangri la Rd
- 11202 N 38th Ave
- 3816 W Yucca St
- 3736 W Shangri la Rd
- 3735 W Yucca St
- 3814 W Shangri la Rd
- 3821 W Yucca St
- 3822 W Yucca St
- 3751 W Shangri la Rd
- 11207 N 38th Ave
- 3743 W Shangri la Rd Unit 3
- 11021 N 38th Dr
- 3801 W Shangri la Rd