M
Seller's Agent in 2020
Margaret Noblitt
Coldwell Banker Smith Home Rltrs-OS
Estimated Value: $462,710 - $523,000
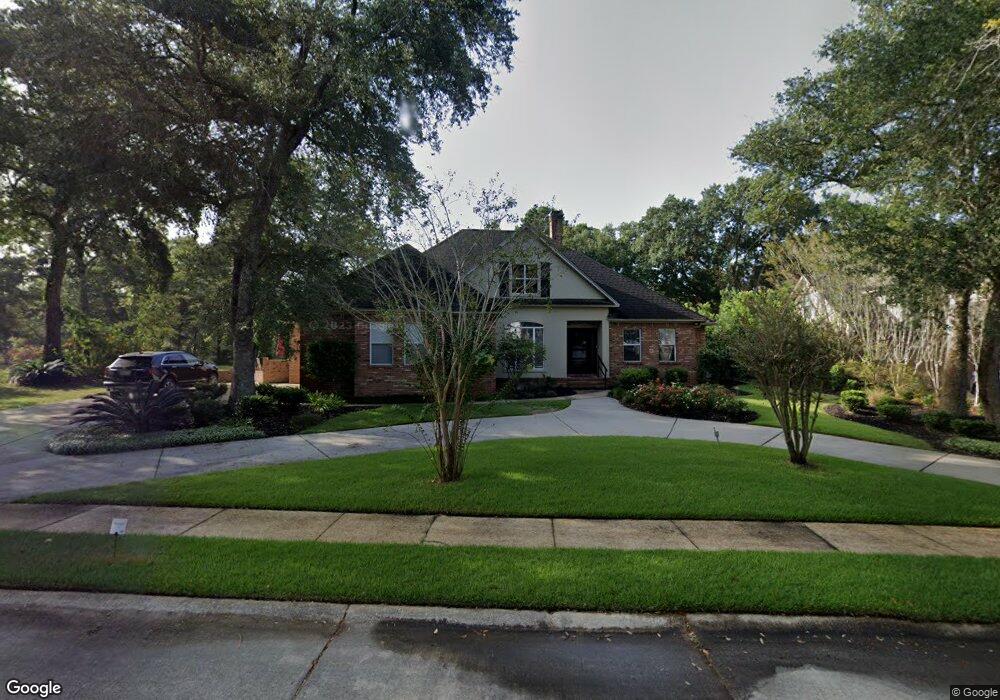
Located in desirable Bienville Place overlooking the lake. Has large patio. You enter foyer, a Large open Living Room/Formal Dining with tall ceilings and a fireplace. Large den off the back that could be a second Master or a in- law suite. Has a beautiful sun porch for afternoons. Lots of parking circular drive an additional double driveway to garage. (Drapes & hardware,rods, etc, as well as all appliances in Laundry room go with sellers.
| Date | Buyer | Sale Price | Title Company |
|---|---|---|---|
| Vandomelen David F | -- | None Available |
| Date | Status | Borrower | Loan Amount |
|---|---|---|---|
| Open | Vandomelen David F | $238,400 |
| Date | Event | Price | List to Sale | Price per Sq Ft | Prior Sale |
|---|---|---|---|---|---|
| 12/04/2020 12/04/20 | Sold | -- | -- | -- | View Prior Sale |
| 10/23/2020 10/23/20 | Pending | -- | -- | -- | |
| 08/20/2020 08/20/20 | For Sale | $380,000 | +13.5% | $124 / Sq Ft | |
| 10/07/2016 10/07/16 | Sold | -- | -- | -- | View Prior Sale |
| 08/05/2016 08/05/16 | Pending | -- | -- | -- | |
| 03/01/2016 03/01/16 | For Sale | $334,900 | -- | $109 / Sq Ft |
| Year | Tax Paid | Tax Assessment Tax Assessment Total Assessment is a certain percentage of the fair market value that is determined by local assessors to be the total taxable value of land and additions on the property. | Land | Improvement |
|---|---|---|---|---|
| 2024 | $2,497 | $24,826 | $3,796 | $21,030 |
| 2023 | $2,497 | $24,826 | $3,796 | $21,030 |
| 2022 | $3,325 | $24,826 | $3,796 | $21,030 |
| 2021 | $3,286 | $24,911 | $3,796 | $21,115 |
| 2020 | $2,191 | $22,569 | $3,874 | $18,695 |
| 2019 | $2,183 | $22,569 | $3,874 | $18,695 |
| 2018 | $2,172 | $22,569 | $3,874 | $18,695 |
| 2017 | $4,880 | $33,854 | $5,811 | $28,043 |
| 2016 | $2,826 | $22,143 | $3,874 | $18,269 |
| 2015 | $2,582 | $200,350 | $38,740 | $161,610 |
| 2014 | $2,652 | $20,671 | $3,874 | $16,797 |
| 2013 | $2,585 | $20,671 | $3,874 | $16,797 |
M
Seller's Agent in 2020
Margaret Noblitt
Coldwell Banker Smith Home Rltrs-OS
B
Buyer's Agent in 2020
Billy Sherrill
Drummond Realty, LLC
C
Seller's Agent in 2016
Craig Joachim
Harvey & Joachim Realty, LLC
(228) 872-8744
26 in this area
64 Total Sales
J
Buyer's Agent in 2016
Janie Rayner
Buyer's Realty
