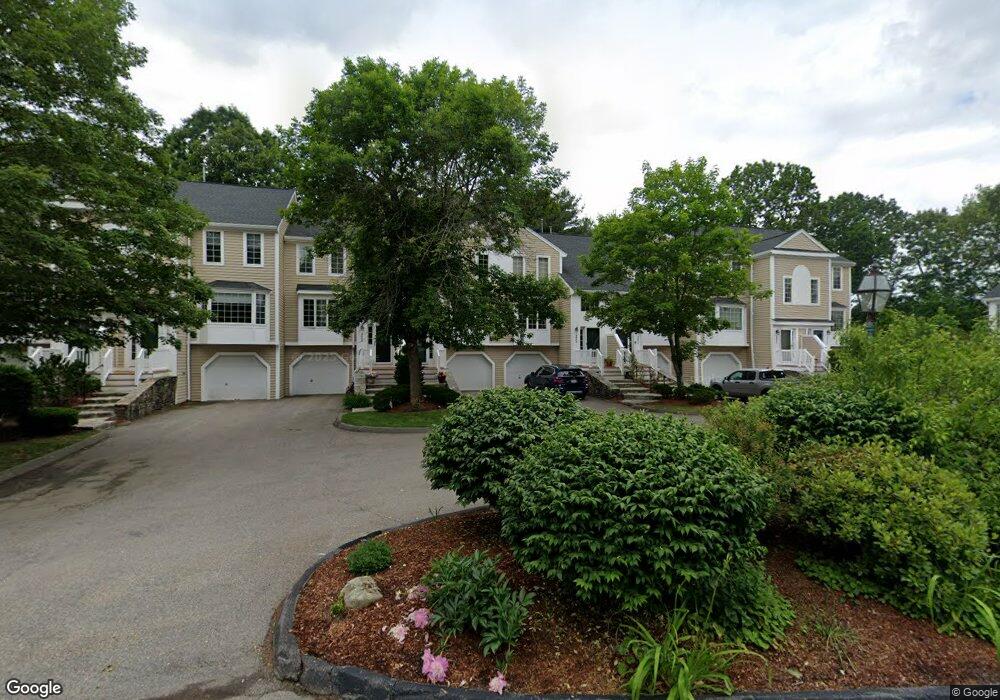
3802 Knightsbridge Close Worcester, MA 01609
Forest Grove NeighborhoodEstimated Value: $453,000 - $526,000
2
Beds
3
Baths
1,606
Sq Ft
$299/Sq Ft
Est. Value
About This Home
This home is located at 3802 Knightsbridge Close, Worcester, MA 01609 and is currently estimated at $479,397, approximately $298 per square foot. 3802 Knightsbridge Close is a home located in Worcester County with nearby schools including Chandler Magnet, Jacob Hiatt Magnet School, and Flagg Street School.
Ownership History
Date
Name
Owned For
Owner Type
Purchase Details
Closed on
Aug 1, 2018
Sold by
Gray Jami E
Bought by
Goncalves Emilie S and Golenberg Jesse T
Current Estimated Value
Purchase Details
Closed on
Mar 28, 2003
Sold by
Debs Elizabeth M and Santora Steven
Bought by
Gray Jami E
Home Financials for this Owner
Home Financials are based on the most recent Mortgage that was taken out on this home.
Original Mortgage
$215,900
Interest Rate
5.91%
Mortgage Type
Purchase Money Mortgage
Purchase Details
Closed on
Sep 4, 1996
Sold by
Longmire Lynda F
Bought by
Debs Elizabeth and Santora Steven
Home Financials for this Owner
Home Financials are based on the most recent Mortgage that was taken out on this home.
Original Mortgage
$81,400
Interest Rate
8.11%
Mortgage Type
Purchase Money Mortgage
Create a Home Valuation Report for This Property
The Home Valuation Report is an in-depth analysis detailing your home's value as well as a comparison with similar homes in the area
Home Values in the Area
Average Home Value in this Area
Purchase History
We collect this data history from publicly available records. To have your information removed, we recommend requesting removal directly through your county’s website.
| Date | Buyer | Sale Price | Title Company |
|---|---|---|---|
| Goncalves Emilie S | -- | -- | |
| Gray Jami E | $269,900 | -- | |
| Debs Elizabeth | $116,000 | -- |
Source: Public Records
Mortgage History
We collect this data history from publicly available records. To have your information removed, we recommend requesting removal directly through your county’s website.
| Date | Status | Borrower | Loan Amount |
|---|---|---|---|
| Previous Owner | Debs Elizabeth | $224,830 | |
| Previous Owner | Debs Elizabeth | $215,900 | |
| Previous Owner | Debs Elizabeth | $13,400 | |
| Previous Owner | Debs Elizabeth | $81,400 |
Source: Public Records
Tax History
| Year | Tax Paid | Tax Assessment Tax Assessment Total Assessment is a certain percentage of the fair market value that is determined by local assessors to be the total taxable value of land and additions on the property. | Land | Improvement |
|---|---|---|---|---|
| 2025 | $5,527 | $419,000 | $0 | $419,000 |
| 2024 | $4,914 | $357,400 | $0 | $357,400 |
| 2023 | $4,435 | $309,300 | $0 | $309,300 |
| 2022 | $4,049 | $266,200 | $0 | $266,200 |
| 2021 | $4,470 | $274,600 | $0 | $274,600 |
| 2020 | $4,151 | $244,200 | $0 | $244,200 |
| 2019 | $3,924 | $218,000 | $0 | $218,000 |
| 2018 | $4,141 | $219,000 | $0 | $219,000 |
| 2017 | $4,109 | $213,800 | $0 | $213,800 |
| 2016 | $4,213 | $204,400 | $0 | $204,400 |
| 2015 | $4,090 | $203,800 | $0 | $203,800 |
| 2014 | $3,033 | $155,200 | $0 | $155,200 |
Source: Public Records
Map
Nearby Homes
- 3901 Knightsbridge Close Unit 3901
- 770 Salisbury St Unit 424
- 6 Barrows Rd
- 7 Primmett Ln
- 3 Summerland Way Unit 3
- 11 Tattan Farm Rd
- 7 Tideswell Ln Unit 7
- 26 Whisper Dr
- 21 Salisbury Hill Blvd
- 306 Fisher Rd
- 7 Albemarle St
- 97 Parkton Ave
- 3 Old Brook Dr
- 531 Salisbury St
- 61 Nelson Place
- 35 Hickory Dr
- 4 King Philip Trail Unit 601
- 202 Torrey Lane Extension Unit 202
- 1 Brookhaven Rd
- 38 Hapgood Rd
- 508 Browning Ln Unit 8
- 3903 Knightsbridge Close
- 3902 Knightsbridge Close
- 3901 Knightsbridge Close
- 3808 Knightsbridge Close
- 3807 Knightsbridge Close
- 3806 Knightsbridge Close
- 3805 Knightsbridge Close
- 3804 Knightsbridge Close
- 3803 Knightsbridge Close
- 3801 Knightsbridge Close
- 3704 Knightsbridge Close
- 3703 Knightsbridge Close
- 3702 Knightsbridge Close
- 3701 Knightsbridge Close
- 3608 Knightsbridge Close
- 3607 Knightsbridge Close
- 3605 Knightsbridge Close
- 3604 Knightsbridge Close
- 3603 Knightsbridge Close
Your Personal Tour Guide
Ask me questions while you tour the home.