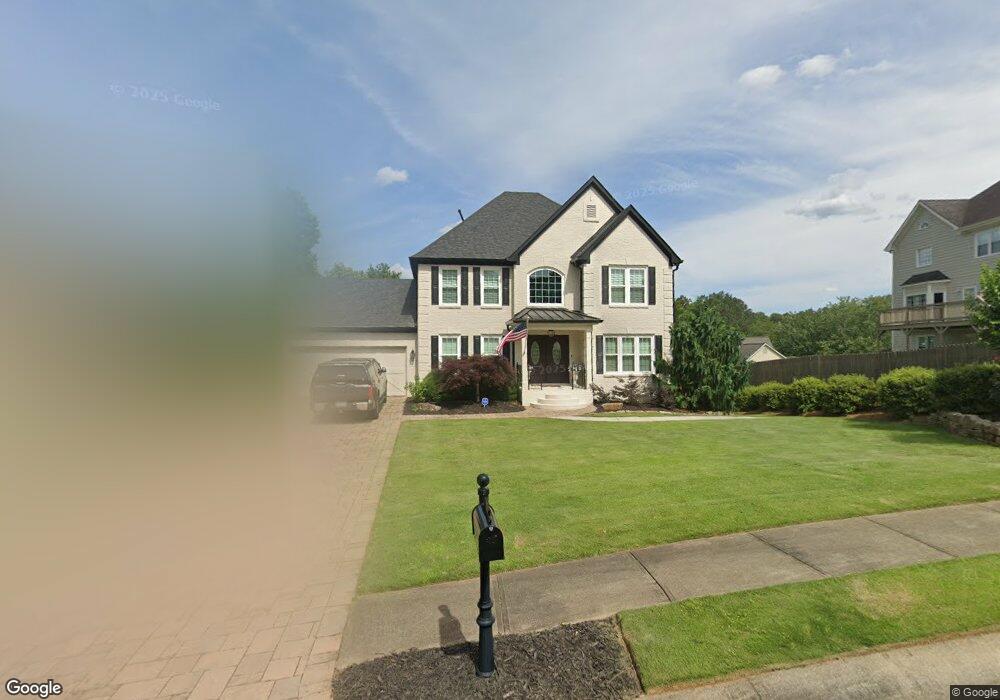
3802 Swallow View NE Marietta, GA 30066
Sandy Plains NeighborhoodEstimated Value: $628,559 - $698,000
3
Beds
3
Baths
2,618
Sq Ft
$257/Sq Ft
Est. Value
About This Home
This home is located at 3802 Swallow View NE, Marietta, GA 30066 and is currently estimated at $672,390, approximately $256 per square foot. 3802 Swallow View NE is a home located in Cobb County with nearby schools including Rocky Mount Elementary School, Simpson Middle School, and Lassiter High School.
Ownership History
Date
Name
Owned For
Owner Type
Purchase Details
Closed on
Nov 2, 2012
Sold by
Beck Lenny
Bought by
Beck Lenny and Beck Nina
Current Estimated Value
Purchase Details
Closed on
Jan 27, 2003
Sold by
Federal Home Loan Mortgage Corporation
Bought by
Dubosarsky Lev and Dubosarsky Nina
Home Financials for this Owner
Home Financials are based on the most recent Mortgage that was taken out on this home.
Original Mortgage
$175,000
Interest Rate
5.95%
Mortgage Type
New Conventional
Purchase Details
Closed on
Nov 5, 2002
Sold by
Crown Bank Fsb
Bought by
Federal Home Loan Mortgage Corporation
Purchase Details
Closed on
Jun 3, 1994
Sold by
Torrey S G Atlanta Ltd
Bought by
Weston Sherman Janett
Home Financials for this Owner
Home Financials are based on the most recent Mortgage that was taken out on this home.
Original Mortgage
$165,050
Interest Rate
8.52%
Create a Home Valuation Report for This Property
The Home Valuation Report is an in-depth analysis detailing your home's value as well as a comparison with similar homes in the area
Home Values in the Area
Average Home Value in this Area
Purchase History
| Date | Buyer | Sale Price | Title Company |
|---|---|---|---|
| Beck Lenny | $109,681 | -- | |
| Beck Lenny | $109,681 | -- | |
| Dubosarsky Lev | -- | -- | |
| Federal Home Loan Mortgage Corporation | -- | -- | |
| Crown Bk Fsb | $205,856 | -- | |
| Weston Sherman Janett | $173,800 | -- |
Source: Public Records
Mortgage History
| Date | Status | Borrower | Loan Amount |
|---|---|---|---|
| Previous Owner | Dubosarsky Lev | $175,000 | |
| Previous Owner | Weston Sherman Janett | $165,050 |
Source: Public Records
Tax History Compared to Growth
Tax History
| Year | Tax Paid | Tax Assessment Tax Assessment Total Assessment is a certain percentage of the fair market value that is determined by local assessors to be the total taxable value of land and additions on the property. | Land | Improvement |
|---|---|---|---|---|
| 2025 | $1,652 | $214,632 | $50,000 | $164,632 |
| 2024 | $1,657 | $214,632 | $50,000 | $164,632 |
| 2023 | $1,418 | $203,680 | $40,000 | $163,680 |
| 2022 | $1,536 | $174,264 | $35,200 | $139,064 |
| 2021 | $1,472 | $152,792 | $35,200 | $117,592 |
| 2020 | $1,472 | $152,792 | $35,200 | $117,592 |
| 2019 | $1,404 | $129,976 | $35,200 | $94,776 |
| 2018 | $3,945 | $129,976 | $35,200 | $94,776 |
| 2017 | $3,534 | $122,932 | $24,000 | $98,932 |
| 2016 | $3,354 | $116,656 | $24,000 | $92,656 |
| 2015 | $3,437 | $116,656 | $24,000 | $92,656 |
| 2014 | $2,649 | $89,152 | $0 | $0 |
Source: Public Records
Map
Nearby Homes
- 3147 Swallow Dr NE
- 3238 Mountain Hollow Dr
- 3130 Maley Ct
- 3851 Timber Hollow Way
- 3798 Upland Dr
- 3350 Brookhill Cir
- 3312 Winter Wood Ct
- 3480 Pebble Hill Dr
- 3623 Summerford Way
- 3901 Hazelhurst Dr
- 2696 S Arbor Dr
- 3505 Bonaire Ct
- 4259 Arbor Club Dr
- 4032 Ashmont Ct
- 2713 Arbor Summit
- 4397 Windsor Oaks Cir
- 4302 Highborne Dr NE Unit 3
- 3144 Swallow Dr NE
- 3804 Swallow View NE
- 3170 Gable Oaks Ct
- 3180 Gable Oaks Ct
- 3146 Swallow Dr NE
- 3801 Swallow View NE
- 3160 Gable Oaks Ct
- 3803 Swallow View NE
- 3190 Gable Oaks Ct
- 3140 Swallow Dr NE
- 3141 Swallow Dr NE
- 3150 Gable Oaks Ct
- 3148 Swallow Dr NE
- 3145 Swallow Dr NE
- 3143 Swallow Dr NE
- 0 Swallow Dr NE Unit 8839000
- 0 Swallow Dr NE Unit 8582037
- 0 Swallow Dr NE Unit 8072555
- 0 Swallow Dr NE Unit 8025540
- 0 Swallow Dr NE Unit 8305883