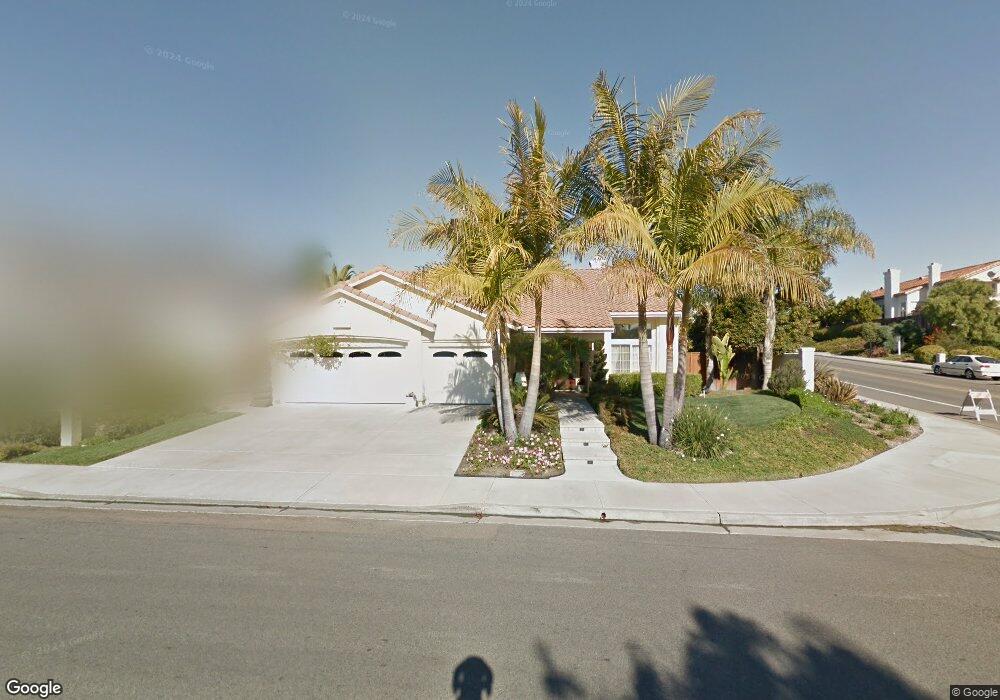
3802 Via Del Rancho Oceanside, CA 92056
Ocean Hills NeighborhoodEstimated Value: $1,160,000 - $1,229,000
3
Beds
3
Baths
2,276
Sq Ft
$526/Sq Ft
Est. Value
About This Home
This home is located at 3802 Via Del Rancho, Oceanside, CA 92056 and is currently estimated at $1,198,057, approximately $526 per square foot. 3802 Via Del Rancho is a home located in San Diego County with nearby schools including Lake Elementary School, Madison Middle School, and Rancho Buena Vista High School.
Ownership History
Date
Name
Owned For
Owner Type
Purchase Details
Closed on
Mar 22, 2021
Sold by
Barbour Patricia Anne
Bought by
Barbour Patricia Anne and The Patricia A Barbour Trust
Current Estimated Value
Home Financials for this Owner
Home Financials are based on the most recent Mortgage that was taken out on this home.
Original Mortgage
$154,000
Outstanding Balance
$114,374
Interest Rate
2.8%
Mortgage Type
New Conventional
Estimated Equity
$1,083,683
Purchase Details
Closed on
Mar 13, 2020
Sold by
Barbour Patricia Anne
Bought by
Barbour Patricia Anne and The Patricia A Barbour Trust
Purchase Details
Closed on
Jun 2, 1998
Sold by
Standard Pacific L P
Bought by
Barbour Patricia Anne
Home Financials for this Owner
Home Financials are based on the most recent Mortgage that was taken out on this home.
Original Mortgage
$224,550
Interest Rate
6.71%
Create a Home Valuation Report for This Property
The Home Valuation Report is an in-depth analysis detailing your home's value as well as a comparison with similar homes in the area
Home Values in the Area
Average Home Value in this Area
Purchase History
| Date | Buyer | Sale Price | Title Company |
|---|---|---|---|
| Barbour Patricia Anne | -- | Radian Settlement Svcs Inc | |
| Barbour Patricia Anne | -- | Accommodation | |
| Barbour Patricia Anne | -- | None Available | |
| Barbour Patricia Anne | $281,000 | First American Title |
Source: Public Records
Mortgage History
| Date | Status | Borrower | Loan Amount |
|---|---|---|---|
| Open | Barbour Patricia Anne | $154,000 | |
| Previous Owner | Barbour Patricia Anne | $224,550 |
Source: Public Records
Tax History Compared to Growth
Tax History
| Year | Tax Paid | Tax Assessment Tax Assessment Total Assessment is a certain percentage of the fair market value that is determined by local assessors to be the total taxable value of land and additions on the property. | Land | Improvement |
|---|---|---|---|---|
| 2025 | $4,666 | $440,504 | $141,082 | $299,422 |
| 2024 | $4,666 | $431,867 | $138,316 | $293,551 |
| 2023 | $4,553 | $423,400 | $135,604 | $287,796 |
| 2022 | $4,540 | $415,099 | $132,946 | $282,153 |
| 2021 | $4,437 | $406,961 | $130,340 | $276,621 |
| 2020 | $4,421 | $402,789 | $129,004 | $273,785 |
| 2019 | $4,355 | $394,892 | $126,475 | $268,417 |
| 2018 | $4,139 | $387,150 | $123,996 | $263,154 |
| 2017 | $4,061 | $379,560 | $121,565 | $257,995 |
| 2016 | $3,963 | $372,119 | $119,182 | $252,937 |
| 2015 | $3,947 | $366,530 | $117,392 | $249,138 |
| 2014 | $3,848 | $359,351 | $115,093 | $244,258 |
Source: Public Records
Map
Nearby Homes
- 3678 Via Bernardo
- 4695 Adra Way
- 2042 Redwood Crest
- 4943 Marin Dr
- 1533 Promontory Ridge Way
- 1829 Shadowood Cir
- 1745 Crystal Ridge Way
- 4994 Alicante Way
- 4981 Marin Dr
- 6055 Dassia Way
- 4655 Barcelona Way
- 1930 Rosewood St
- 4664 Cordoba Way
- 1916 Rosewood St
- 5071 Nighthawk Way
- 4763 Galicia Way
- 1533 Laurelwood Way
- 1622 Fig Tree Way
- 4058 Lemnos Way
- 5056 Nighthawk Way
- 3806 Via Del Rancho
- 5178 Berryessa St
- 3702 Via Del Rancho
- 3810 Via Del Rancho
- 3798 Via Las Villas
- 3706 Via Del Rancho Unit 5
- 5175 Berryessa St
- 3801 Via Del Rancho
- 3805 Via Del Rancho
- 3814 Via Del Rancho
- 3796 Via Las Villas
- 3813 Via Del Rancho
- 3710 Via Del Rancho
- 3703 Via Del Rancho
- 3707 Via Del Rancho
- 3794 Via Las Villas
- 5170 Berryessa St
- 3817 Via Del Rancho
- 5171 Berryessa St
- 3809 Via Del Rancho