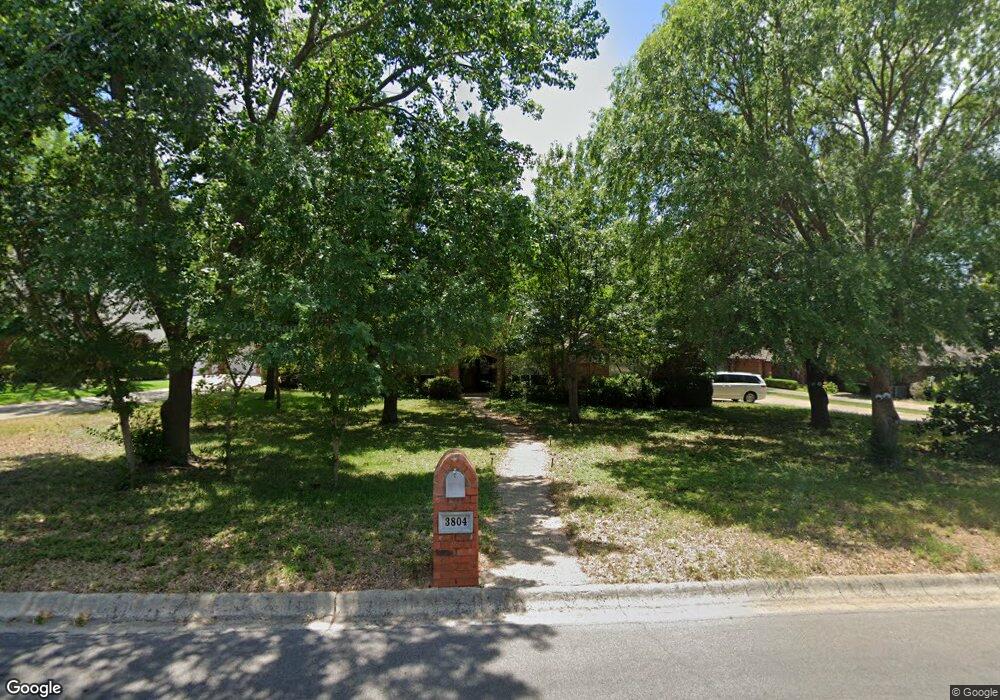
3804 Montecito Dr Denton, TX 76205
South Denton NeighborhoodEstimated Value: $585,507 - $644,000
4
Beds
3
Baths
2,805
Sq Ft
$220/Sq Ft
Est. Value
About This Home
This home is located at 3804 Montecito Dr, Denton, TX 76205 and is currently estimated at $617,627, approximately $220 per square foot. 3804 Montecito Dr is a home located in Denton County with nearby schools including Ryan Elementary School, McMath Middle School, and Denton High School.
Ownership History
Date
Name
Owned For
Owner Type
Purchase Details
Closed on
Mar 14, 1999
Sold by
Shaffer Brian
Bought by
Shaffer Michelle
Current Estimated Value
Purchase Details
Closed on
Jul 12, 1995
Sold by
Hodges Carl W and Hodges Carole G
Bought by
Shaffer Brian S
Home Financials for this Owner
Home Financials are based on the most recent Mortgage that was taken out on this home.
Original Mortgage
$156,000
Interest Rate
7.22%
Mortgage Type
Purchase Money Mortgage
Purchase Details
Closed on
Nov 11, 1993
Sold by
Pearson Donald F
Bought by
Hodges Carl W and Hodges Carole G
Home Financials for this Owner
Home Financials are based on the most recent Mortgage that was taken out on this home.
Original Mortgage
$170,250
Interest Rate
6.86%
Create a Home Valuation Report for This Property
The Home Valuation Report is an in-depth analysis detailing your home's value as well as a comparison with similar homes in the area
Home Values in the Area
Average Home Value in this Area
Purchase History
| Date | Buyer | Sale Price | Title Company |
|---|---|---|---|
| Shaffer Michelle | -- | -- | |
| Shaffer Brian S | -- | -- | |
| Shaffer Brian S | -- | -- | |
| Hodges Carl W | -- | -- |
Source: Public Records
Mortgage History
| Date | Status | Borrower | Loan Amount |
|---|---|---|---|
| Previous Owner | Shaffer Brian S | $156,000 | |
| Previous Owner | Hodges Carl W | $170,250 |
Source: Public Records
Tax History
| Year | Tax Paid | Tax Assessment Tax Assessment Total Assessment is a certain percentage of the fair market value that is determined by local assessors to be the total taxable value of land and additions on the property. | Land | Improvement |
|---|---|---|---|---|
| 2025 | $8,643 | $560,750 | $145,418 | $428,582 |
| 2024 | $8,643 | $509,773 | $145,418 | $398,582 |
| 2023 | $7,651 | $463,430 | $139,586 | $427,414 |
| 2022 | $8,943 | $421,300 | $145,418 | $377,582 |
| 2021 | $8,514 | $383,000 | $106,743 | $276,257 |
| 2020 | $8,594 | $376,000 | $106,743 | $269,257 |
| 2019 | $8,864 | $371,500 | $106,743 | $264,757 |
| 2018 | $8,431 | $349,000 | $78,302 | $270,698 |
| 2017 | $8,925 | $361,064 | $78,302 | $294,698 |
| 2016 | $8,305 | $328,240 | $78,302 | $251,198 |
| 2015 | $7,433 | $298,400 | $78,302 | $220,098 |
| 2014 | $7,433 | $307,700 | $78,302 | $229,398 |
| 2013 | -- | $287,000 | $67,116 | $219,884 |
Source: Public Records
Map
Nearby Homes
- 3805 Granada Trail
- 3825 Montecito Dr
- 3612 Granada Trail
- 3704 Granada Trail
- 1313 Lorelei Ln
- 3601 Monte Carlo Ln
- 3913 Andrew Ave
- Tbd El Cielito St
- 900 Mallard Ave
- 1008 Turtle Creek Ave
- 917 Fallbrook Ave
- 44 Wellington Oaks Cir
- 4516 Hammerstein Blvd
- 817 Fallbrook Ave
- 3916 Maggies Meadow
- 3321 Monte Carlo Ln
- 912 Fallbrook Ave
- 4105 Ranchman Blvd
- 3100 Masthead Dr
- 917 Circle View Ln
- 3800 Montecito Dr
- 3813 Granada Trail
- 3809 Granada Trail
- 3805 Montecito Dr
- 3817 Granada Trail
- 3812 Montecito Dr
- 608 Seville Rd
- 3801 Montecito Dr
- 3809 Montecito Dr
- 3805 Granada Trail
- 3813 Montecito Dr
- 000 Granada Trail
- 3821 Granada Trail
- 604 Seville Rd
- 700 Seville Rd
- 3816 Montecito Dr
- 3808 Granada Trail
- 3812 Granada Trail
- 3817 Montecito Dr
- 701 Seville Rd
Your Personal Tour Guide
Ask me questions while you tour the home.