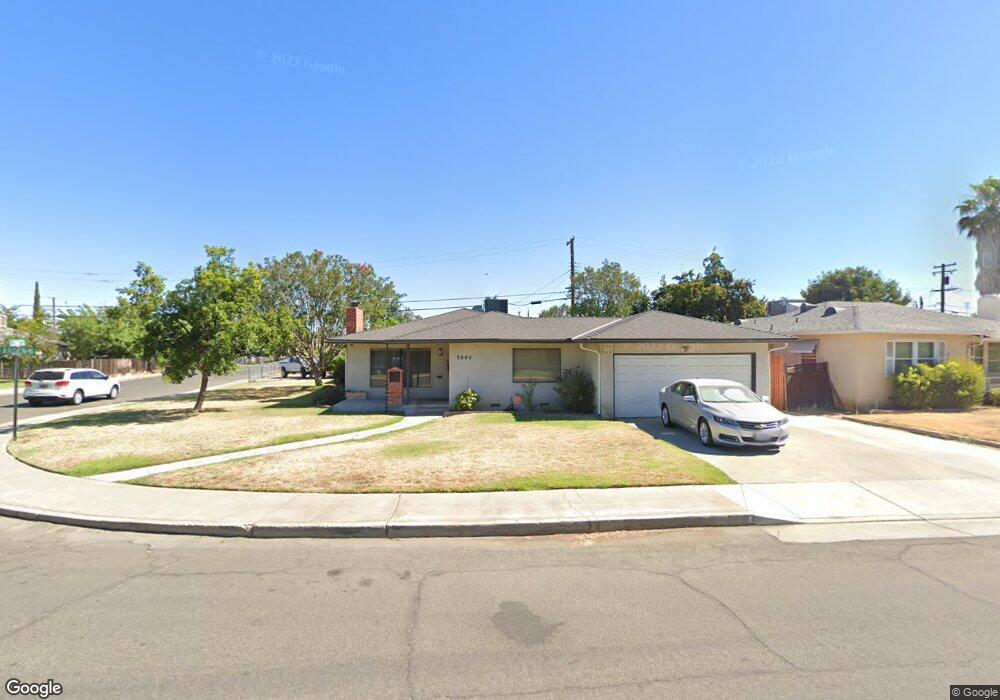
3805 Arden Dr N Fresno, CA 93703
McLane NeighborhoodEstimated Value: $318,000 - $371,000
3
Beds
2
Baths
1,389
Sq Ft
$246/Sq Ft
Est. Value
About This Home
This home is located at 3805 Arden Dr N, Fresno, CA 93703 and is currently estimated at $341,691, approximately $245 per square foot. 3805 Arden Dr N is a home located in Fresno County with nearby schools including Wishon Elementary School, Scandinavian Middle School, and Mclane High School.
Ownership History
Date
Name
Owned For
Owner Type
Purchase Details
Closed on
Apr 20, 2017
Sold by
Larson Philip D
Bought by
Larson Philip D and Larson Laverne Kay
Current Estimated Value
Purchase Details
Closed on
Nov 28, 2016
Sold by
Larson Laveme Kay
Bought by
Larson Philip D
Home Financials for this Owner
Home Financials are based on the most recent Mortgage that was taken out on this home.
Original Mortgage
$155,800
Interest Rate
3.52%
Mortgage Type
New Conventional
Purchase Details
Closed on
Oct 14, 2016
Sold by
Lee Dorothy Helen and Griffy Thomas Allen
Bought by
Larson Philip D
Home Financials for this Owner
Home Financials are based on the most recent Mortgage that was taken out on this home.
Original Mortgage
$155,800
Interest Rate
3.52%
Mortgage Type
New Conventional
Purchase Details
Closed on
Jul 8, 1998
Sold by
Griffy Lee Dorothy
Bought by
Dorothy Helen Lee Revocable Living Trust and Lee Dorothy Helen
Create a Home Valuation Report for This Property
The Home Valuation Report is an in-depth analysis detailing your home's value as well as a comparison with similar homes in the area
Home Values in the Area
Average Home Value in this Area
Purchase History
| Date | Buyer | Sale Price | Title Company |
|---|---|---|---|
| Larson Philip D | -- | None Available | |
| Larson Philip D | -- | Fidelity National Title Co | |
| Larson Philip D | $164,000 | Fidelity National Title Co | |
| Dorothy Helen Lee Revocable Living Trust | -- | -- | |
| Lee Dorothy Griffy | -- | -- |
Source: Public Records
Mortgage History
| Date | Status | Borrower | Loan Amount |
|---|---|---|---|
| Previous Owner | Larson Philip D | $155,800 |
Source: Public Records
Tax History Compared to Growth
Tax History
| Year | Tax Paid | Tax Assessment Tax Assessment Total Assessment is a certain percentage of the fair market value that is determined by local assessors to be the total taxable value of land and additions on the property. | Land | Improvement |
|---|---|---|---|---|
| 2025 | $2,324 | $190,330 | $46,420 | $143,910 |
| 2023 | $2,279 | $182,941 | $44,618 | $138,323 |
| 2022 | $2,249 | $179,355 | $43,744 | $135,611 |
| 2021 | $2,187 | $175,839 | $42,887 | $132,952 |
| 2020 | $2,178 | $174,037 | $42,448 | $131,589 |
| 2019 | $2,093 | $170,625 | $41,616 | $129,009 |
| 2018 | $2,048 | $167,280 | $40,800 | $126,480 |
| 2017 | $2,013 | $84,752 | $11,913 | $72,839 |
| 2016 | $932 | $83,091 | $11,680 | $71,411 |
| 2015 | $916 | $81,844 | $11,505 | $70,339 |
| 2014 | $898 | $80,242 | $11,280 | $68,962 |
Source: Public Records
Map
Nearby Homes
- 3803 E Clinton Ave
- 2042 Mayfair Dr E
- 2154 Norris Dr E
- 3514 Mayfair Dr N
- 4054 Arden Dr S
- 3415 E Terrace Ave
- 2240
- 0 Tba Unit 634245
- 3250 E Clinton Ave
- 4318 E Fairfax Ave
- 2044 Mayfair Dr W
- 3256 Mayfair Blvd
- 3803 E Shields Ave
- 2513 N 2nd St
- 3140 E Weldon Ave
- 2136 N First St
- 2126 N First St
- 2414 N 1st St
- 2128 N First St
- 3404 E Home Ave
- 3815 Arden Dr N
- 2264 N Lomita Ave
- 3816 Kenmore Dr N
- 3825 Arden Dr N
- 2255 N Lomita Ave
- 3814 Arden Dr N
- 3826 Kenmore Dr N
- 2240 N Lomita Ave
- 2245 N Lomita Ave
- 3754 Kenmore Dr N
- 3835 Arden Dr N
- 2159 Arden Dr W
- 3836 Kenmore Dr N
- 2235 N Lomita Ave
- 2232 N Lomita Ave
- 3742 Kenmore Dr N
- 2147 Arden Dr W
- 3902 Kenmore Dr N
- 3801 Kenmore Dr N