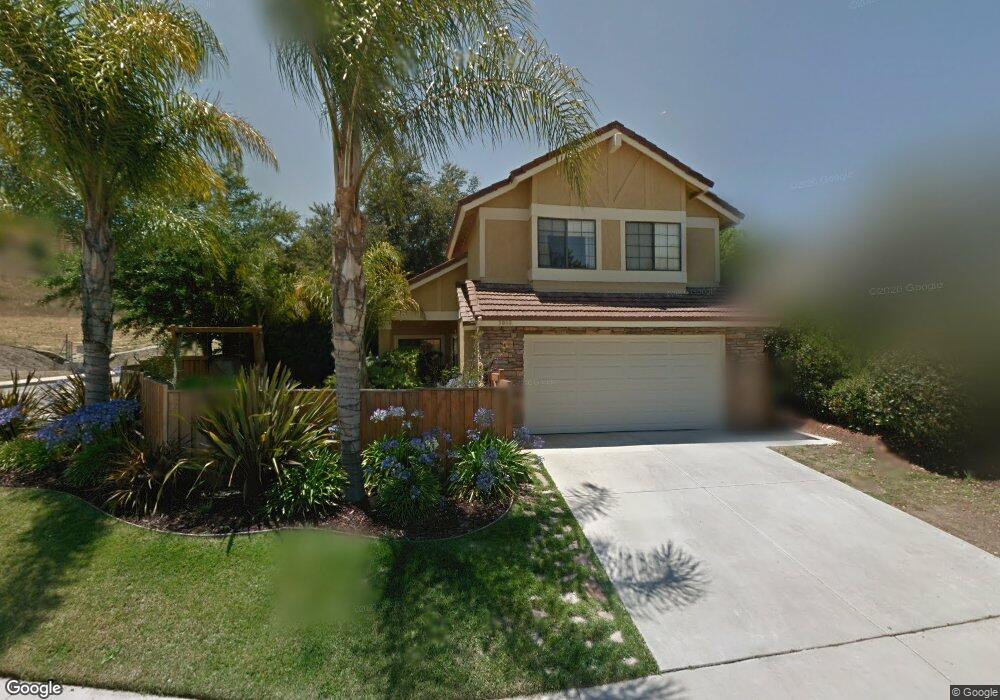
3805 Lost Springs Dr Calabasas, CA 91301
Estimated Value: $1,250,252 - $1,438,000
3
Beds
3
Baths
1,731
Sq Ft
$764/Sq Ft
Est. Value
About This Home
This home is located at 3805 Lost Springs Dr, Calabasas, CA 91301 and is currently estimated at $1,321,813, approximately $763 per square foot. 3805 Lost Springs Dr is a home located in Los Angeles County with nearby schools including Lupin Hill Elementary, Arthur E. Wright Middle School, and Calabasas High School.
Ownership History
Date
Name
Owned For
Owner Type
Purchase Details
Closed on
Dec 8, 2022
Sold by
Olen Douglas W and Olen Melissa S
Bought by
Douglas And Melissa Olen Living Trust and Olen
Current Estimated Value
Purchase Details
Closed on
Jun 2, 2003
Sold by
Goldstein Pauline E
Bought by
Olen Douglas W and Olen Melissa S
Home Financials for this Owner
Home Financials are based on the most recent Mortgage that was taken out on this home.
Original Mortgage
$379,600
Interest Rate
5%
Mortgage Type
Purchase Money Mortgage
Purchase Details
Closed on
Jun 9, 1998
Sold by
Williams Noelle
Bought by
Goldstein Pauline E
Home Financials for this Owner
Home Financials are based on the most recent Mortgage that was taken out on this home.
Original Mortgage
$228,400
Interest Rate
7.17%
Purchase Details
Closed on
Dec 18, 1997
Sold by
Johnston Keii E
Bought by
Williams Noelle and Johnston Noelle W
Create a Home Valuation Report for This Property
The Home Valuation Report is an in-depth analysis detailing your home's value as well as a comparison with similar homes in the area
Home Values in the Area
Average Home Value in this Area
Purchase History
| Date | Buyer | Sale Price | Title Company |
|---|---|---|---|
| Douglas And Melissa Olen Living Trust | -- | None Listed On Document | |
| Olen Douglas W | $474,500 | Fidelity National Title Co | |
| Goldstein Pauline E | $285,500 | Fidelity Title Company | |
| Williams Noelle | -- | -- |
Source: Public Records
Mortgage History
| Date | Status | Borrower | Loan Amount |
|---|---|---|---|
| Previous Owner | Olen Douglas W | $379,600 | |
| Previous Owner | Goldstein Pauline E | $228,400 | |
| Closed | Olen Douglas W | $71,100 |
Source: Public Records
Tax History Compared to Growth
Tax History
| Year | Tax Paid | Tax Assessment Tax Assessment Total Assessment is a certain percentage of the fair market value that is determined by local assessors to be the total taxable value of land and additions on the property. | Land | Improvement |
|---|---|---|---|---|
| 2025 | $8,124 | $687,213 | $524,142 | $163,071 |
| 2024 | $8,124 | $673,739 | $513,865 | $159,874 |
| 2023 | $7,879 | $660,530 | $503,790 | $156,740 |
| 2022 | $7,632 | $647,579 | $493,912 | $153,667 |
| 2021 | $7,609 | $634,882 | $484,228 | $150,654 |
| 2019 | $7,339 | $616,053 | $469,866 | $146,187 |
| 2018 | $7,263 | $603,974 | $460,653 | $143,321 |
| 2016 | $6,888 | $580,522 | $442,766 | $137,756 |
| 2015 | $6,773 | $571,803 | $436,116 | $135,687 |
| 2014 | $6,682 | $560,604 | $427,574 | $133,030 |
Source: Public Records
Map
Nearby Homes
- 3966 Leighton Point Rd
- 4229 Via Mira Monte
- 26823 Hot Springs Place
- 4240 Lost Hills Rd Unit 503
- 4240 Lost Hills Rd Unit 1702
- 4240 Lost Hills Rd Unit 1902
- 4240 Lost Hills Rd Unit 3004
- 4201 Las Virgenes Rd Unit 112
- 4201 Las Virgenes Rd Unit 115
- 4201 Las Virgenes Rd Unit 220
- 4275 Las Virgenes Rd Unit 3
- 4322 Willow Glen St
- 27326 Oak Summit Rd
- 3936 United Rd
- 5021 Ambridge Dr
- 27311 Country Glen Rd
- 3952 Patrick Henry Place
- 26950 Helmond Dr
- 27300 Agoura Rd
- 27417 Park Vista Rd
- 3811 Lost Springs Dr
- 3815 Lost Springs Dr
- 3806 Raven Ct
- 3821 Lost Springs Dr
- 3802 Raven Ct
- 3806 Lost Springs Dr
- 3810 Lost Springs Dr
- 3802 Lost Springs Dr
- 3814 Lost Springs Dr
- 3825 Lost Springs Dr
- 3818 Lost Springs Dr
- 3803 Raven Ct
- 3822 Lost Springs Dr
- 3831 Lost Springs Dr
- 3826 Lost Springs Dr
- 3835 Lost Springs Dr
- 3805 Raven Ct
- 3832 Lost Springs Dr
- 3807 Raven Ct
- 3809 Raven Ct