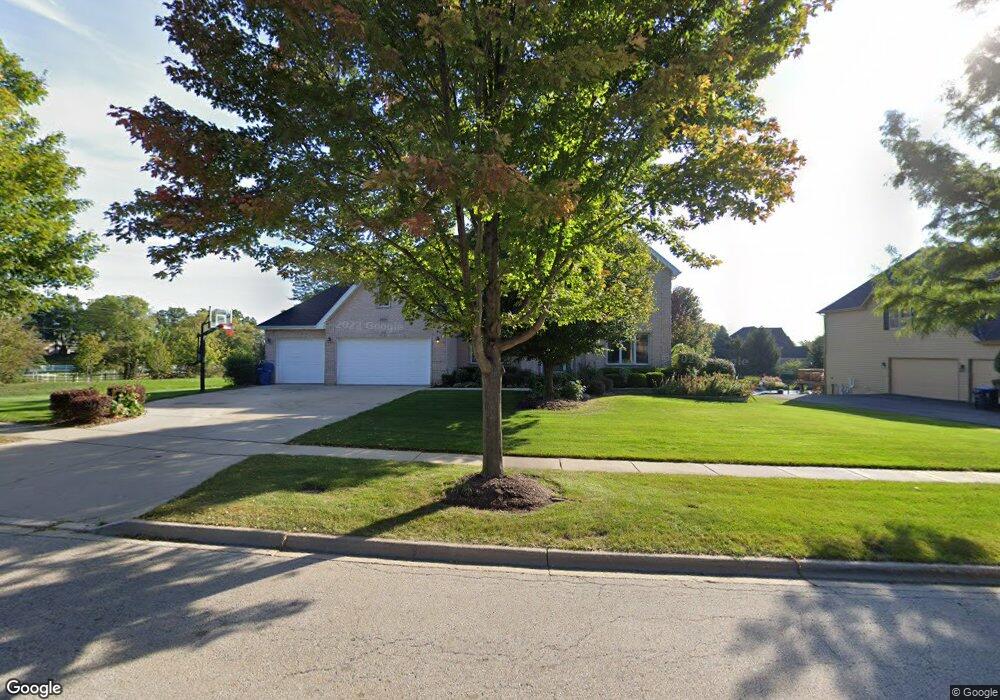
3806 Chesapeake Rd Unit 7 Saint Charles, IL 60175
Farmington-Fox River Valley NeighborhoodEstimated Value: $724,000 - $1,067,000
5
Beds
4
Baths
5,200
Sq Ft
$175/Sq Ft
Est. Value
About This Home
This home is located at 3806 Chesapeake Rd Unit 7, Saint Charles, IL 60175 and is currently estimated at $908,847, approximately $174 per square foot. 3806 Chesapeake Rd Unit 7 is a home located in Kane County with nearby schools including Wild Rose Elementary School, Wredling Middle School, and St Charles North High School.
Ownership History
Date
Name
Owned For
Owner Type
Purchase Details
Closed on
Jul 29, 2011
Sold by
Rowley Stephen M and Rowley Susan M
Bought by
Philips Nibu and Phillips Jolly
Current Estimated Value
Home Financials for this Owner
Home Financials are based on the most recent Mortgage that was taken out on this home.
Original Mortgage
$410,000
Outstanding Balance
$283,614
Interest Rate
4.55%
Mortgage Type
New Conventional
Estimated Equity
$625,233
Purchase Details
Closed on
Jan 31, 2002
Sold by
Adamo Vincenzo and Adamo Marisa J
Bought by
Rowley Stephen M and Rowley Susan M
Home Financials for this Owner
Home Financials are based on the most recent Mortgage that was taken out on this home.
Original Mortgage
$367,000
Interest Rate
7.23%
Purchase Details
Closed on
Dec 15, 2000
Sold by
J Carl Homes Inc
Bought by
Adamo Vincenzo and Adamo Marisa J
Create a Home Valuation Report for This Property
The Home Valuation Report is an in-depth analysis detailing your home's value as well as a comparison with similar homes in the area
Home Values in the Area
Average Home Value in this Area
Purchase History
| Date | Buyer | Sale Price | Title Company |
|---|---|---|---|
| Philips Nibu | $530,000 | Greater Illinois Title Co | |
| Rowley Stephen M | $557,000 | Chicago Title Insurance Co | |
| Adamo Vincenzo | $118,000 | Chicago Title Insurance Co |
Source: Public Records
Mortgage History
| Date | Status | Borrower | Loan Amount |
|---|---|---|---|
| Open | Philips Nibu | $410,000 | |
| Previous Owner | Rowley Stephen M | $367,000 |
Source: Public Records
Tax History Compared to Growth
Tax History
| Year | Tax Paid | Tax Assessment Tax Assessment Total Assessment is a certain percentage of the fair market value that is determined by local assessors to be the total taxable value of land and additions on the property. | Land | Improvement |
|---|---|---|---|---|
| 2024 | $17,972 | $249,369 | $40,964 | $208,405 |
| 2023 | $17,280 | $223,189 | $36,663 | $186,526 |
| 2022 | $16,216 | $206,452 | $38,552 | $167,900 |
| 2021 | $15,593 | $196,214 | $36,748 | $159,466 |
| 2020 | $15,434 | $192,556 | $36,063 | $156,493 |
| 2019 | $15,162 | $188,743 | $35,349 | $153,394 |
| 2018 | $15,266 | $188,940 | $35,795 | $153,145 |
| 2017 | $15,906 | $194,589 | $34,571 | $160,018 |
| 2016 | $17,637 | $197,937 | $33,357 | $164,580 |
| 2015 | -- | $193,986 | $32,997 | $160,989 |
| 2014 | -- | $178,416 | $32,997 | $145,419 |
| 2013 | -- | $183,325 | $33,327 | $149,998 |
Source: Public Records
Map
Nearby Homes
- 5N070 State Route 31
- 5N400 Fence Rail Ct
- 4N922 Dover Hill Rd
- 5N024 Il Route 31
- 37W004 Ridgewood Dr
- 5N661 Leola Ln
- 135 Thornhill Farm Ln Unit 1
- 4N675 Old Farm Rd
- 36W824 Red Gate Ct
- 4N680 Ware Woods Dr
- 5N092 Grove Ave
- 6N362 Riverside Dr
- 6N323 Riverside Dr
- 106 Sumac Ct
- 36W172 Silver Glen Ct
- 4016 Faith Ln
- 4032 Faith Ln
- 4009 Faith Ln
- 43W321 Creekside Ct
- 1987 Sagebrook Dr
- 3804 Chesapeake Rd
- 3810 Greenwood Ln
- 3802 Chesapeake Rd
- 3805 Chesapeake Rd Unit 7
- 3805 Chesapeake Rd
- 3807 Chesapeake Rd
- 3803 Chesapeake Rd
- 3808 Greenwood Ln
- 3801 Chesapeake Rd
- 3705 Chesapeake Rd Unit 7
- 3809 Greenwood Ln
- 3807 Greenwood Ln
- 3806 Greenwood Ln Unit 7
- 3805 Greenwood Ln Unit 7
- 3803 Greenwood Ln
- 3703 Chesapeake Rd Unit 7
- 3608 Chesapeake Rd
- 3810 Tradition Blvd
- 3804 Greenwood Ln
- 3801 Greenwood Ln