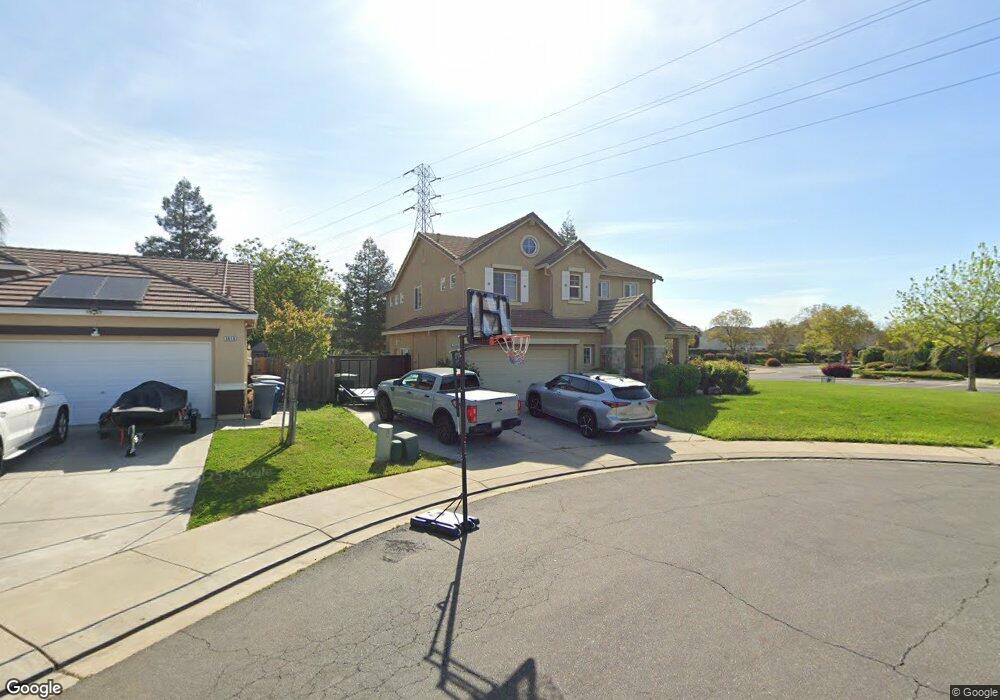
3806 Colma Ct Merced, CA 95348
Estimated Value: $481,000 - $524,000
4
Beds
3
Baths
2,372
Sq Ft
$210/Sq Ft
Est. Value
About This Home
This home is located at 3806 Colma Ct, Merced, CA 95348 and is currently estimated at $498,427, approximately $210 per square foot. 3806 Colma Ct is a home located in Merced County with nearby schools including Franklin Elementary School, Rudolph Rivera Middle School, and El Capitan High School.
Ownership History
Date
Name
Owned For
Owner Type
Purchase Details
Closed on
Nov 8, 2005
Sold by
Merced Shadow Creek Lp
Bought by
Burns Ricky and Burns Jasmin
Current Estimated Value
Home Financials for this Owner
Home Financials are based on the most recent Mortgage that was taken out on this home.
Original Mortgage
$372,278
Outstanding Balance
$202,604
Interest Rate
5.93%
Mortgage Type
Fannie Mae Freddie Mac
Estimated Equity
$295,823
Create a Home Valuation Report for This Property
The Home Valuation Report is an in-depth analysis detailing your home's value as well as a comparison with similar homes in the area
Home Values in the Area
Average Home Value in this Area
Purchase History
| Date | Buyer | Sale Price | Title Company |
|---|---|---|---|
| Burns Ricky | $465,500 | Old Republic Title Company |
Source: Public Records
Mortgage History
| Date | Status | Borrower | Loan Amount |
|---|---|---|---|
| Open | Burns Ricky | $372,278 |
Source: Public Records
Tax History Compared to Growth
Tax History
| Year | Tax Paid | Tax Assessment Tax Assessment Total Assessment is a certain percentage of the fair market value that is determined by local assessors to be the total taxable value of land and additions on the property. | Land | Improvement |
|---|---|---|---|---|
| 2025 | $6,051 | $479,000 | $120,000 | $359,000 |
| 2024 | $6,051 | $460,500 | $120,000 | $340,500 |
| 2023 | $5,837 | $441,000 | $105,000 | $336,000 |
| 2022 | $5,917 | $450,500 | $85,000 | $365,500 |
| 2021 | $4,660 | $335,000 | $85,000 | $250,000 |
| 2020 | $4,541 | $320,000 | $80,000 | $240,000 |
| 2019 | $4,690 | $333,500 | $65,000 | $268,500 |
| 2018 | $4,066 | $301,000 | $55,000 | $246,000 |
| 2017 | $4,147 | $294,000 | $45,000 | $249,000 |
| 2016 | $3,834 | $267,000 | $45,000 | $222,000 |
| 2015 | $3,415 | $231,000 | $45,000 | $186,000 |
| 2014 | $3,490 | $239,000 | $30,000 | $209,000 |
Source: Public Records
Map
Nearby Homes