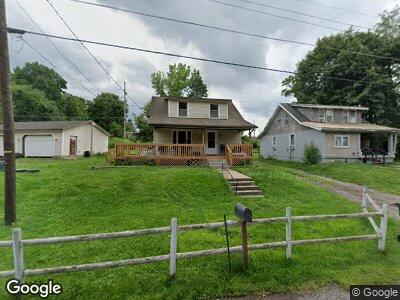
3806 Euclid St NE Canton, OH 44704
Canton Outskirts NeighborhoodEstimated Value: $108,000 - $157,000
--
Bed
--
Bath
600
Sq Ft
$221/Sq Ft
Est. Value
About This Home
This home is located at 3806 Euclid St NE, Canton, OH 44704 and is currently estimated at $132,500, approximately $220 per square foot. 3806 Euclid St NE is a home located in Stark County with nearby schools including Faircrest Memorial Elementary School, Canton South High School, and East Branch Preparatory Academy Wright Preparatory Academy.
Ownership History
Date
Name
Owned For
Owner Type
Purchase Details
Closed on
Apr 17, 2020
Sold by
Burns Roland and Bruns Terry
Bought by
Burns Roland and Burns Terry
Current Estimated Value
Purchase Details
Closed on
Jun 17, 2008
Sold by
Newman Dennis L and Newman Linda L
Bought by
Burns Roland and Burns Terry
Home Financials for this Owner
Home Financials are based on the most recent Mortgage that was taken out on this home.
Original Mortgage
$27,500
Outstanding Balance
$18,238
Interest Rate
6.04%
Mortgage Type
Seller Take Back
Estimated Equity
$100,762
Purchase Details
Closed on
Aug 8, 2007
Sold by
Stutler Roger and Stutler Sonia
Bought by
Newman Dennis M
Purchase Details
Closed on
Oct 15, 2002
Sold by
Stutler Roger K and Stutler Sonia
Bought by
Stutler Roger and Stutler Sonia
Purchase Details
Closed on
Sep 10, 1997
Sold by
Stutler Roger K
Bought by
Newman Dennis
Purchase Details
Closed on
Oct 20, 1994
Sold by
Sheppard William B
Bought by
Stutler Roger K and Stutler Sonia
Create a Home Valuation Report for This Property
The Home Valuation Report is an in-depth analysis detailing your home's value as well as a comparison with similar homes in the area
Home Values in the Area
Average Home Value in this Area
Purchase History
| Date | Buyer | Sale Price | Title Company |
|---|---|---|---|
| Burns Roland | -- | None Available | |
| Burns Roland | $32,500 | None Available | |
| Newman Dennis M | $16,700 | Attorney | |
| Stutler Roger | -- | -- | |
| Newman Dennis | $16,650 | -- | |
| Stutler Roger K | $16,000 | -- |
Source: Public Records
Mortgage History
| Date | Status | Borrower | Loan Amount |
|---|---|---|---|
| Open | Burns Roland | $27,500 |
Source: Public Records
Tax History Compared to Growth
Tax History
| Year | Tax Paid | Tax Assessment Tax Assessment Total Assessment is a certain percentage of the fair market value that is determined by local assessors to be the total taxable value of land and additions on the property. | Land | Improvement |
|---|---|---|---|---|
| 2024 | -- | $14,810 | $14,040 | $770 |
| 2023 | $357 | $9,240 | $8,120 | $1,120 |
| 2022 | $353 | $9,240 | $8,120 | $1,120 |
| 2021 | $355 | $9,240 | $8,120 | $1,120 |
| 2020 | $345 | $8,190 | $7,420 | $770 |
| 2019 | $172 | $8,210 | $7,430 | $780 |
| 2018 | $337 | $8,210 | $7,430 | $780 |
| 2017 | $336 | $7,500 | $6,760 | $740 |
| 2016 | $341 | $7,570 | $6,830 | $740 |
| 2015 | $344 | $7,570 | $6,830 | $740 |
| 2014 | $324 | $6,480 | $5,850 | $630 |
| 2013 | $165 | $6,480 | $5,850 | $630 |
Source: Public Records
Map
Nearby Homes
- 362 Jettie Ave NE
- 3307 Lincoln St E
- 0 Quail Hollow Ave NE Unit 5132024
- 544 Hamilton Ave NE
- 0 Baumford Ave SE
- 5308 Walters St NE
- 5112 Lincoln St E
- 5130 Winfield St NE
- 5458 Walters St NE
- 425 Girard Ave NE
- 2318 3rd St SE
- 2400 Winfield Way NE
- 2150 2nd St SE
- 1617 Royal Ave NE
- 3421 Mahoning Rd NE
- 323 Belden Ave NE
- 2438 Indiana Way NE
- 2529 17th St NE
- 2116 Harmont Ave NE
- 2026 2nd St NE
- 3806 Euclid St NE
- 3806 Euclid St NE
- 3800 Euclid St NE
- 3811 Euclid St NE
- 3811 Euclid St NE
- 3811 Euclid St NE
- 3811 Euclid St NE
- 3811 Euclid St NE
- 3813 Euclid St NE
- 3910 Euclid St NE
- 3931 Euclid St NE
- 839 Hollywood Ave NE
- 839 Hollywood Ave NE
- 847 Hollywood Ave NE
- 3812 Georgetown Rd NE
- 810 Hollywood Ave NE
- 3822 Georgetown Rd NE
- 3755 Georgetown Rd NE
- 907 Hollywood Ave NE
- 858 Hollywood Ave NE