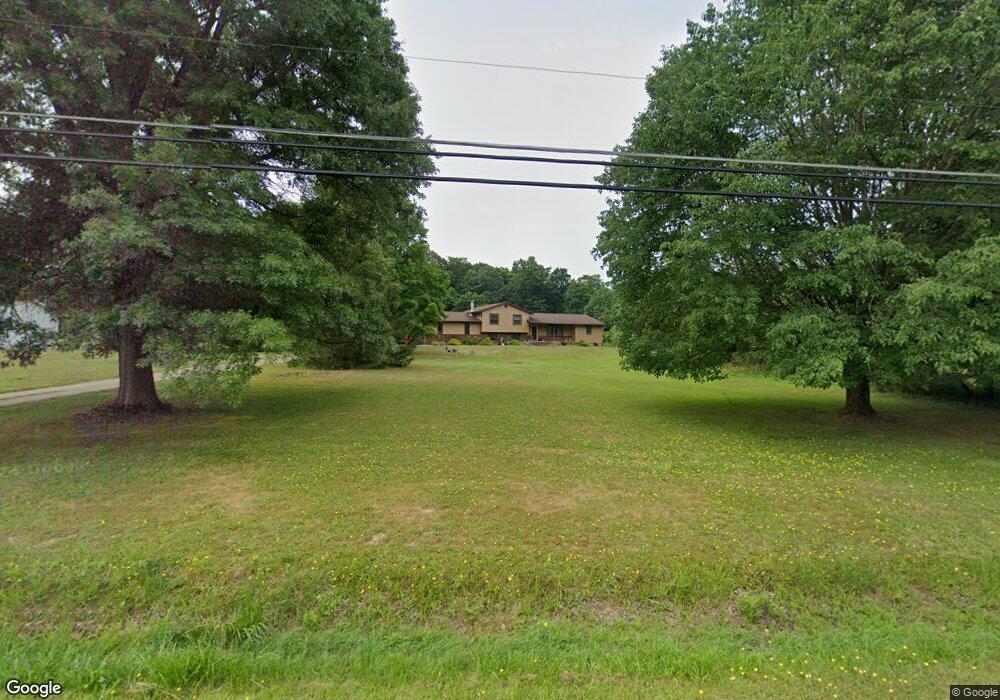
3806 Laubert Rd Atwater, OH 44201
Estimated Value: $290,560 - $352,000
4
Beds
3
Baths
1,630
Sq Ft
$195/Sq Ft
Est. Value
About This Home
This home is located at 3806 Laubert Rd, Atwater, OH 44201 and is currently estimated at $317,640, approximately $194 per square foot. 3806 Laubert Rd is a home located in Portage County with nearby schools including Waterloo Elementary School, Waterloo Middle School, and Waterloo High School.
Ownership History
Date
Name
Owned For
Owner Type
Purchase Details
Closed on
Apr 1, 2021
Sold by
Jones Steven A and Jones Michelle R
Bought by
Jones Michelle R
Current Estimated Value
Home Financials for this Owner
Home Financials are based on the most recent Mortgage that was taken out on this home.
Original Mortgage
$147,861
Outstanding Balance
$133,285
Interest Rate
2.9%
Mortgage Type
FHA
Estimated Equity
$184,355
Purchase Details
Closed on
Sep 2, 1999
Sold by
Greathouse William E and Greathouse Rita J
Bought by
Jones Steven A and Jones Michelle R
Home Financials for this Owner
Home Financials are based on the most recent Mortgage that was taken out on this home.
Original Mortgage
$140,000
Interest Rate
7.93%
Purchase Details
Closed on
Jan 1, 1990
Bought by
Greathouse William E
Create a Home Valuation Report for This Property
The Home Valuation Report is an in-depth analysis detailing your home's value as well as a comparison with similar homes in the area
Home Values in the Area
Average Home Value in this Area
Purchase History
| Date | Buyer | Sale Price | Title Company |
|---|---|---|---|
| Jones Michelle R | -- | Amrock Inc | |
| Jones Steven A | $156,500 | Progressive Title Agency Inc | |
| Greathouse William E | -- | -- |
Source: Public Records
Mortgage History
| Date | Status | Borrower | Loan Amount |
|---|---|---|---|
| Open | Jones Michelle R | $147,861 | |
| Closed | Jones Steven A | $140,000 |
Source: Public Records
Tax History Compared to Growth
Tax History
| Year | Tax Paid | Tax Assessment Tax Assessment Total Assessment is a certain percentage of the fair market value that is determined by local assessors to be the total taxable value of land and additions on the property. | Land | Improvement |
|---|---|---|---|---|
| 2024 | $3,725 | $96,710 | $14,350 | $82,360 |
| 2023 | $2,613 | $57,650 | $11,030 | $46,620 |
| 2022 | $2,677 | $57,650 | $11,030 | $46,620 |
| 2021 | $2,684 | $57,650 | $11,030 | $46,620 |
| 2020 | $2,248 | $49,880 | $11,030 | $38,850 |
| 2019 | $2,264 | $49,880 | $11,030 | $38,850 |
| 2018 | $2,344 | $51,560 | $8,260 | $43,300 |
| 2017 | $2,344 | $51,560 | $8,260 | $43,300 |
| 2016 | $2,338 | $51,560 | $8,260 | $43,300 |
| 2015 | $2,365 | $51,560 | $8,260 | $43,300 |
| 2014 | $2,326 | $49,110 | $8,260 | $40,850 |
| 2013 | $2,253 | $49,110 | $8,260 | $40,850 |
Source: Public Records
Map
Nearby Homes
- 3952 Laubert Rd
- 3459 Laubert Rd
- 7377 Pontius St NE
- 14865 Millrich Cir NE
- 0 Hartville Rd
- 0 Pontius St NE
- 1291 State Route 44
- 4829 Laubert Rd
- 3705 Alexander Rd
- 3381 Alexander Rd
- 0 New Milford Rd Unit 5119787
- 3079 Alexander Rd
- 0 Waterloo Rd
- 1696 State Route 44
- 0 Shaffer Rd
- 4324 Abbey Ln
- 1772 Hartville Rd
- 5296 Eberly Rd
- 14350 Reeder Ave NE
- 1628 New Milford Rd
- 3822 Laubert Rd
- 3836 Laubert Rd
- 3795 Laubert Rd
- 3756 Laubert Rd
- 3772 Laubert Rd
- 3769 Laubert Rd
- 3850 Laubert Rd
- 3732 Laubert Rd
- 3743 Laubert Rd
- 3864 Laubert Rd
- 3876 Laubert Rd
- 3867 Laubert Rd
- 3892 Laubert Rd
- 3785 Laubert Rd
- 3717 Laubert Rd
- 3895 Laubert Rd
- 3712 Laubert Rd
- 3908 Laubert Rd
- 3913 Laubert Rd
- 3695 Laubert Rd