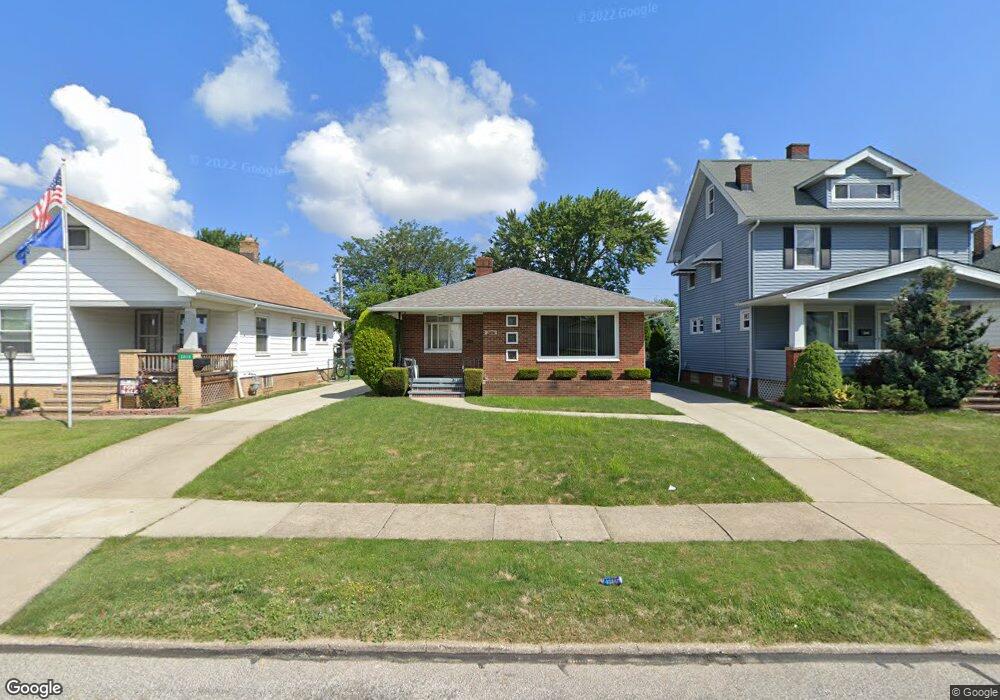
3806 Pershing Ave Cleveland, OH 44134
Estimated Value: $175,248 - $189,000
2
Beds
1
Bath
1,164
Sq Ft
$158/Sq Ft
Est. Value
About This Home
This home is located at 3806 Pershing Ave, Cleveland, OH 44134 and is currently estimated at $183,562, approximately $157 per square foot. 3806 Pershing Ave is a home located in Cuyahoga County with nearby schools including Thoreau Park Elementary School, Shiloh Middle School, and Normandy High School.
Ownership History
Date
Name
Owned For
Owner Type
Purchase Details
Closed on
Aug 28, 2012
Sold by
Yaremko Anna
Bought by
Yaremko Yaroslav and Yaremko Bogdan
Current Estimated Value
Purchase Details
Closed on
Aug 15, 2012
Sold by
Estate Of Rudolf Yaremko
Bought by
Yaremko Anna
Purchase Details
Closed on
Jul 31, 2005
Sold by
Lozitsky Leonid
Bought by
Yaremko Rudolf and Yaremko Anna
Purchase Details
Closed on
Jun 28, 2005
Sold by
Lozitsky Leonid
Bought by
Yaremko Rudolf and Yaremko Anna
Purchase Details
Closed on
Jul 12, 1999
Sold by
Josephine Tracy
Bought by
Lozitskiy Mikhail
Purchase Details
Closed on
Jun 24, 1993
Sold by
Tracy Frank
Bought by
Tracy Josephine
Purchase Details
Closed on
Jan 9, 1978
Sold by
Tracy Frank and Tracy Josne
Bought by
Tracy Frank
Purchase Details
Closed on
Jan 1, 1975
Bought by
Tracy Frank and Tracy Josne
Create a Home Valuation Report for This Property
The Home Valuation Report is an in-depth analysis detailing your home's value as well as a comparison with similar homes in the area
Home Values in the Area
Average Home Value in this Area
Purchase History
| Date | Buyer | Sale Price | Title Company |
|---|---|---|---|
| Yaremko Yaroslav | -- | Attorney | |
| Yaremko Anna | -- | None Available | |
| Yaremko Rudolf | $115,000 | -- | |
| Yaremko Rudolf | $101,300 | -- | |
| Lozitskiy Mikhail | $104,000 | City Title Company Agency In | |
| Tracy Josephine | -- | -- | |
| Tracy Frank | -- | -- | |
| Tracy Frank | -- | -- |
Source: Public Records
Tax History
| Year | Tax Paid | Tax Assessment Tax Assessment Total Assessment is a certain percentage of the fair market value that is determined by local assessors to be the total taxable value of land and additions on the property. | Land | Improvement |
|---|---|---|---|---|
| 2024 | $2,849 | $55,440 | $10,920 | $44,520 |
| 2023 | $2,373 | $41,480 | $9,000 | $32,480 |
| 2022 | $2,375 | $41,480 | $9,000 | $32,480 |
| 2021 | $2,440 | $41,480 | $9,000 | $32,480 |
| 2020 | $1,996 | $31,920 | $6,930 | $24,990 |
| 2019 | $1,890 | $91,200 | $19,800 | $71,400 |
| 2018 | $1,716 | $31,920 | $6,930 | $24,990 |
| 2017 | $1,675 | $27,510 | $5,180 | $22,330 |
| 2016 | $1,665 | $27,510 | $5,180 | $22,330 |
| 2015 | $1,569 | $27,510 | $5,180 | $22,330 |
| 2014 | $1,569 | $28,080 | $5,290 | $22,790 |
Source: Public Records
Map
Nearby Homes
- 4000 Pershing Ave
- 4101 Pershing Ave
- 4312 Kenmore Ave
- 4410 Wood Ave
- 5432 State Rd
- 4011 Liggett Dr
- 3407 Grovewood Ave
- 3810 Lincoln Ave
- 4419 Lincoln Ave
- 3326 Grovewood Ave
- 4323 Russell Ave
- 3802 Russell Ave
- 3214 Liggett Dr
- 4607 Lincoln Ave
- 3106 Brookdale Ave
- 3006 Torrington Ave
- 4007 Tuxedo Ave
- 3104 Liggett Dr
- 3106 Grovewood Ave
- 4115 Sheraton Dr
- 3802 Pershing Ave
- 3810 Pershing Ave
- 3714 Pershing Ave
- 3902 Pershing Ave
- 3712 Pershing Ave
- 3906 Pershing Ave
- 3807 Torrington Ave
- 3803 Torrington Ave
- 3910 Pershing Ave
- 3706 Pershing Ave
- 3901 Torrington Ave
- 3715 Torrington Ave
- 3905 Torrington Ave
- 3807 Pershing Ave
- 3803 Pershing Ave
- 3811 Pershing Ave
- 3715 Pershing Ave
- 3903 Pershing Ave
- 3909 Torrington Ave
- 3707 Torrington Ave
Your Personal Tour Guide
Ask me questions while you tour the home.