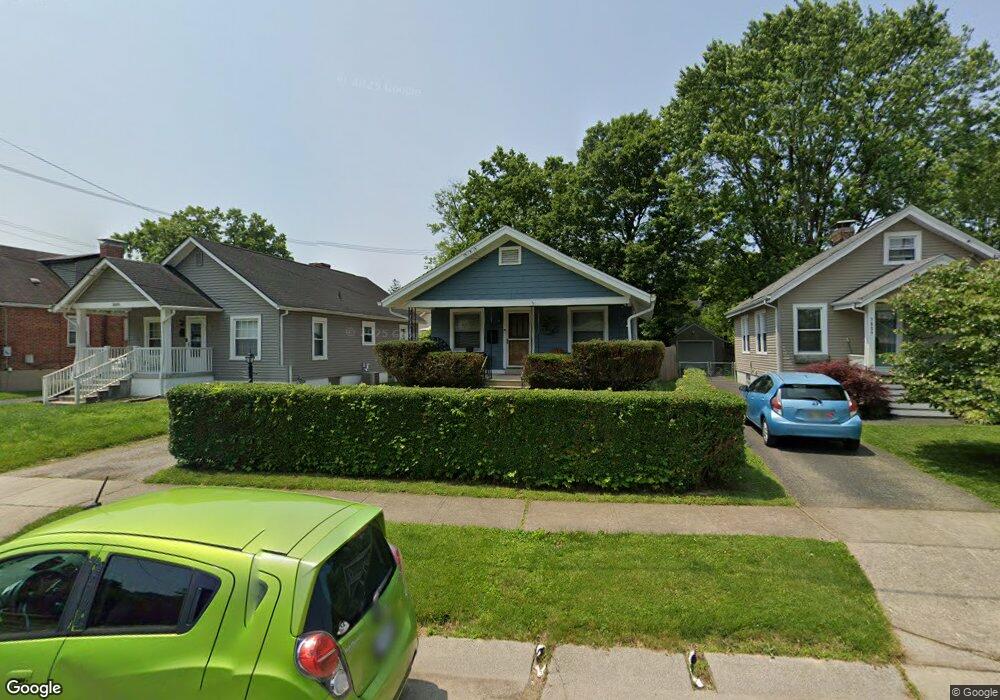
3807 Camden Ave Cincinnati, OH 45227
Estimated Value: $208,000 - $255,000
2
Beds
1
Bath
768
Sq Ft
$301/Sq Ft
Est. Value
About This Home
This home is located at 3807 Camden Ave, Cincinnati, OH 45227 and is currently estimated at $231,457, approximately $301 per square foot. 3807 Camden Ave is a home located in Hamilton County with nearby schools including Terrace Park Elementary School, Mariemont Elementary School, and Mariemont Junior High School.
Ownership History
Date
Name
Owned For
Owner Type
Purchase Details
Closed on
Apr 23, 2004
Sold by
Gertz Kristy M and Gertz Anthony J
Bought by
Beck Robert H and Beck Edwina C
Current Estimated Value
Home Financials for this Owner
Home Financials are based on the most recent Mortgage that was taken out on this home.
Original Mortgage
$104,000
Outstanding Balance
$49,793
Interest Rate
5.91%
Mortgage Type
Unknown
Estimated Equity
$181,664
Purchase Details
Closed on
Aug 30, 2000
Sold by
Lehmann Samuel T
Bought by
Wheatley Kristy Marie
Home Financials for this Owner
Home Financials are based on the most recent Mortgage that was taken out on this home.
Original Mortgage
$61,000
Interest Rate
8.15%
Create a Home Valuation Report for This Property
The Home Valuation Report is an in-depth analysis detailing your home's value as well as a comparison with similar homes in the area
Home Values in the Area
Average Home Value in this Area
Purchase History
| Date | Buyer | Sale Price | Title Company |
|---|---|---|---|
| Beck Robert H | $107,300 | Advanced Land Title Agency L | |
| Wheatley Kristy Marie | $66,000 | -- |
Source: Public Records
Mortgage History
| Date | Status | Borrower | Loan Amount |
|---|---|---|---|
| Open | Beck Robert H | $104,000 | |
| Previous Owner | Wheatley Kristy Marie | $61,000 |
Source: Public Records
Tax History Compared to Growth
Tax History
| Year | Tax Paid | Tax Assessment Tax Assessment Total Assessment is a certain percentage of the fair market value that is determined by local assessors to be the total taxable value of land and additions on the property. | Land | Improvement |
|---|---|---|---|---|
| 2024 | $4,005 | $54,531 | $20,136 | $34,395 |
| 2023 | $3,715 | $54,531 | $20,136 | $34,395 |
| 2022 | $3,334 | $40,548 | $10,812 | $29,736 |
| 2021 | $3,188 | $40,548 | $10,812 | $29,736 |
| 2020 | $3,223 | $40,548 | $10,812 | $29,736 |
| 2019 | $3,152 | $35,886 | $9,569 | $26,317 |
| 2018 | $3,079 | $35,886 | $9,569 | $26,317 |
| 2017 | $2,645 | $35,886 | $9,569 | $26,317 |
| 2016 | $2,463 | $32,102 | $9,562 | $22,540 |
| 2015 | $2,458 | $32,102 | $9,562 | $22,540 |
| 2014 | $2,466 | $32,102 | $9,562 | $22,540 |
| 2013 | $2,279 | $31,164 | $9,282 | $21,882 |
Source: Public Records
Map
Nearby Homes
- 3812 Carlton St
- 6219 Bedford St
- 6208 Bancroft St
- 3690 Birkdale Ln
- 6576 Wooster Pike
- St Martin Plan at Birkdale
- 3645 Birkdale Ln
- 3674 Birkdale Ln
- 3670 Birkdale Ln
- 3662 Birkdale Ln
- 4115 Homer Ave
- 5809 Elder St
- 3986 S Whetzel Ave
- 3726 Southern Ave
- 3806 Southern Ave
- 6417 Bramble Ave
- 6001 Bramble Ave
- 6507 Britton Ave
- 5919 Bramble Ave
- 6010 Bramble Ave
- 3805 Camden Ave
- 3809 Camden Ave
- 3803 Camden Ave
- 3811 Camden Ave
- 3801 Camden Ave
- 3813 Camden Ave
- 3804 Carlton St
- 3808 Carlton St
- 3802 Carlton St
- 3800 Carlton St
- 3815 Camden Ave
- 3810 Camden Ave
- 3808 Camden Ave
- 3812 Camden Ave
- 3814 Carlton St
- 3814 Camden Ave
- 3817 Camden Ave
- 3800 Camden Ave
- 3814 Carlton Ave
- 3729 Camden Ave